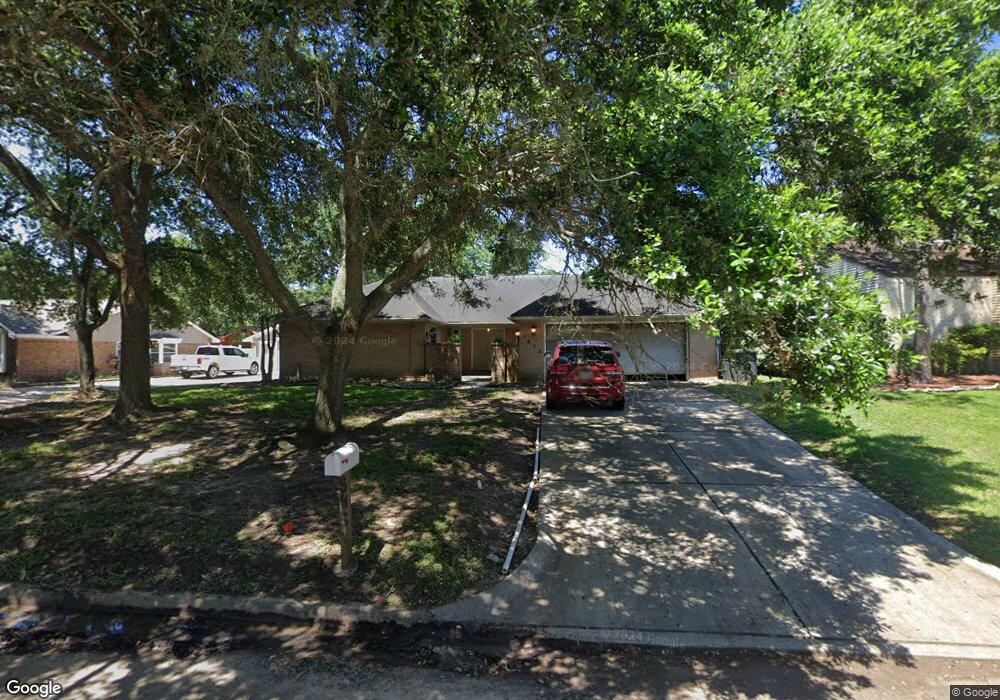
5454 Apple Blossom Ln Friendswood, TX 77546
Estimated Value: $396,100 - $412,000
3
Beds
2
Baths
2,598
Sq Ft
$155/Sq Ft
Est. Value
About This Home
This home is located at 5454 Apple Blossom Ln, Friendswood, TX 77546 and is currently estimated at $403,525, approximately $155 per square foot. 5454 Apple Blossom Ln is a home located in Harris County with nearby schools including Wedgewood Elementary School, Brookside Intermediate School, and Clear Brook High School.
Ownership History
Date
Name
Owned For
Owner Type
Purchase Details
Closed on
Jul 27, 2001
Sold by
Federal National Mortgage Association
Bought by
Parker Roger W and Parker Angela M
Current Estimated Value
Home Financials for this Owner
Home Financials are based on the most recent Mortgage that was taken out on this home.
Original Mortgage
$141,085
Outstanding Balance
$54,637
Interest Rate
7.05%
Mortgage Type
FHA
Estimated Equity
$348,888
Purchase Details
Closed on
Apr 3, 2001
Sold by
Guerra Eloy and Guerra Lauria
Bought by
Federal National Mortgage Association
Purchase Details
Closed on
Oct 4, 1997
Sold by
Jennings Steven R
Bought by
Guerra Eloy
Home Financials for this Owner
Home Financials are based on the most recent Mortgage that was taken out on this home.
Original Mortgage
$119,600
Interest Rate
7.28%
Create a Home Valuation Report for This Property
The Home Valuation Report is an in-depth analysis detailing your home's value as well as a comparison with similar homes in the area
Home Values in the Area
Average Home Value in this Area
Purchase History
| Date | Buyer | Sale Price | Title Company |
|---|---|---|---|
| Parker Roger W | -- | Texas American Title Company | |
| Federal National Mortgage Association | $125,000 | -- | |
| Guerra Eloy | -- | South Land Title Company |
Source: Public Records
Mortgage History
| Date | Status | Borrower | Loan Amount |
|---|---|---|---|
| Open | Parker Roger W | $141,085 | |
| Previous Owner | Guerra Eloy | $119,600 |
Source: Public Records
Tax History Compared to Growth
Tax History
| Year | Tax Paid | Tax Assessment Tax Assessment Total Assessment is a certain percentage of the fair market value that is determined by local assessors to be the total taxable value of land and additions on the property. | Land | Improvement |
|---|---|---|---|---|
| 2025 | $3,957 | $396,237 | $63,740 | $332,497 |
| 2024 | $3,957 | $410,376 | $63,740 | $346,636 |
| 2023 | $3,957 | $454,338 | $63,740 | $390,598 |
| 2022 | $4,785 | $329,608 | $63,740 | $265,868 |
| 2021 | $4,586 | $300,471 | $59,538 | $240,933 |
| 2020 | $4,713 | $267,422 | $49,340 | $218,082 |
| 2019 | $6,536 | $0 | $0 | $0 |
| 2018 | $960 | $189,021 | $42,494 | $146,527 |
| 2017 | $5,571 | $231,414 | $42,494 | $188,920 |
| 2016 | $5,065 | $196,221 | $42,494 | $153,727 |
| 2015 | $4,214 | $196,221 | $42,494 | $153,727 |
| 2014 | $4,214 | $193,202 | $28,329 | $164,873 |
Source: Public Records
Map
Nearby Homes
- 5498 Apple Blossom Ln
- 5323 Abercreek Ave
- 5343 Royal Pkwy
- 16303 Townes Rd
- 5402 Royal Pkwy
- 4311 Townes Forest Rd
- 5339 Appleblossom Ln
- Lots 29 and 42 Block Wedgewood Village Dr
- 16703 Hibiscus Ln
- 16222 Forest Bend Ave
- 16607 David Glen Dr
- 14 Haverford Ln
- 16114 Forest Bend Ave
- 4426 Saffron Ln
- 16406 Blackhawk Blvd
- 4430 Peridot Ln
- 16510 Blackhawk Blvd
- 1303 Deepwood Dr
- 716 Penn Dr
- 16327 Blackhawk Blvd
- 5450 Apple Blossom Ln
- 5458 Apple Blossom Ln
- 5446 Apple Blossom Ln
- 5455 Apple Blossom Ln
- 5451 Apple Blossom Ln
- 5451 Appleblossom Ln
- 5459 Apple Blossom Ln
- 5442 Appleblossom Ln
- 5442 Apple Blossom Ln
- 5466 Apple Blossom Ln
- 5463 Apple Blossom Ln
- 5447 Apple Blossom Ln
- 5438 Appleblossom Ln
- 5438 Apple Blossom Ln
- 5472 Apple Blossom Ln
- 16410 Oxnard Ln
- 16406 Oxnard Ln
- 5467 Apple Blossom Ln
- 5467 Appleblossom Ln
- 16414 Oxnard Ln