L
Landlord's Agent in 2018
Linda Smith
Coldwell Banker (NRT-Southeast-MidAtlantic)


Estimated Value: $599,000 - $607,000
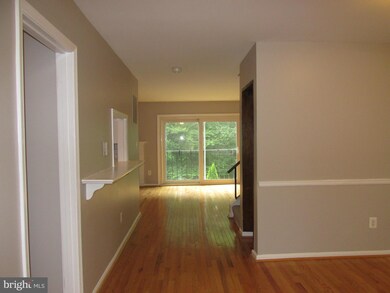
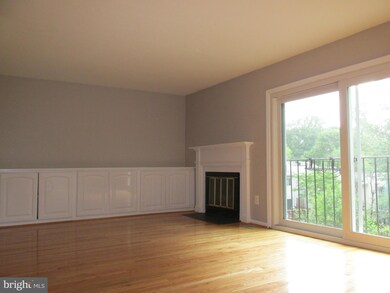
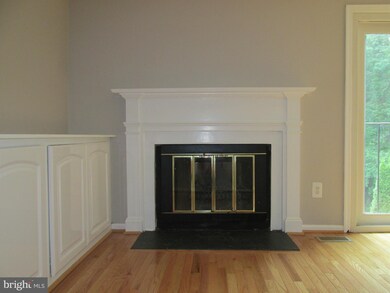
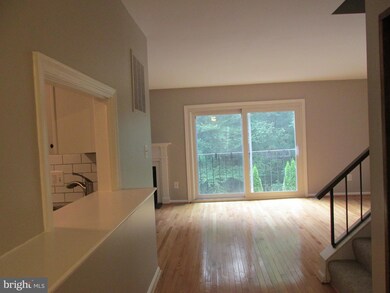
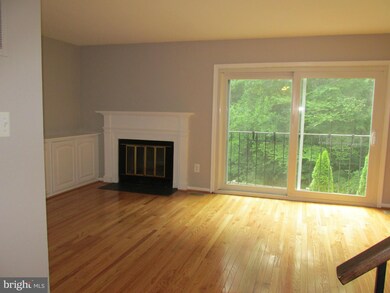
Super clean 3BR/2.5BA End-Unit TH in great central Location - near shops, restaurants, major commuter routes, VRE, & Pool. Renovated thru-out - freshly painted, updated Kitchen, Master BA, HVAC (2015). H/W floors on Main Level. Fully finished LL w/outside access. LL includes large Rec Rm w/wood Fireplace, den & storage/Laundry Rm. Private setting-backs trees. 2-assigned parking spaces
Last Agent to Rent the Property
Linda Smith
(703) 691-1400 lindasmith@cbmove.com Coldwell Banker Realty Listed on: 05/17/2018

Last Renter's Agent
(703) 622-5049 angie@agentangie.com Better Homes and Gardens Real Estate Premier
| Date | Buyer | Sale Price | Title Company |
|---|---|---|---|
| White Mark J | $410,000 | -- |
| Date | Status | Borrower | Loan Amount |
|---|---|---|---|
| Open | White Mark J | $328,000 |
| Date | Event | Price | List to Sale | Price per Sq Ft |
|---|---|---|---|---|
| 06/29/2018 06/29/18 | Rented | $2,400 | 0.0% | -- |
| 06/16/2018 06/16/18 | Under Contract | -- | -- | -- |
| 05/17/2018 05/17/18 | For Rent | $2,400 | 0.0% | -- |
| 08/17/2017 08/17/17 | Rented | $2,400 | 0.0% | -- |
| 08/14/2017 08/14/17 | Under Contract | -- | -- | -- |
| 07/20/2017 07/20/17 | For Rent | $2,400 | +9.3% | -- |
| 07/15/2015 07/15/15 | Rented | $2,195 | 0.0% | -- |
| 07/08/2015 07/08/15 | Under Contract | -- | -- | -- |
| 06/17/2015 06/17/15 | For Rent | $2,195 | +4.8% | -- |
| 03/01/2014 03/01/14 | Rented | $2,095 | 0.0% | -- |
| 02/28/2014 02/28/14 | Under Contract | -- | -- | -- |
| 01/21/2014 01/21/14 | For Rent | $2,095 | -- | -- |
| Year | Tax Paid | Tax Assessment Tax Assessment Total Assessment is a certain percentage of the fair market value that is determined by local assessors to be the total taxable value of land and additions on the property. | Land | Improvement |
|---|---|---|---|---|
| 2021 | $5,299 | $451,580 | $125,000 | $326,580 |
| 2020 | $5,001 | $422,600 | $110,000 | $312,600 |
| 2019 | $4,918 | $415,540 | $105,000 | $310,540 |
| 2018 | $4,689 | $396,230 | $105,000 | $291,230 |
| 2017 | $4,318 | $371,930 | $97,000 | $274,930 |
| 2016 | $4,433 | $382,680 | $105,000 | $277,680 |
| 2015 | $4,121 | $369,280 | $105,000 | $264,280 |
| 2014 | $3,960 | $355,660 | $94,000 | $261,660 |
L
Landlord's Agent in 2018
Linda Smith
Coldwell Banker (NRT-Southeast-MidAtlantic)
Tenant's Agent in 2018
Angelica Delboy
Better Homes and Gardens Real Estate Premier
(703) 622-5049
1 in this area
43 Total Sales
Seller Co-Listing Agent in 2017
Marie La Morena
Coldwell Banker (NRT-Southeast-MidAtlantic)
(202) 320-8880
14 Total Sales
Buyer's Agent in 2017
Jennifer Mack
EXP Realty, LLC
(202) 590-5570
230 Total Sales
Buyer's Agent in 2015
Merlin Smith
RE/MAX
(703) 593-2800
4 Total Sales
N
Seller's Agent in 2014
Norman Domingo
XRealty.NET LLC
(888) 838-9044
1 in this area
1,278 Total Sales
Source: Bright MLS
MLS Number: 1001489440
APN: 077-2-03-0060
Disclaimer: Certain information contained herein is derived from information provided by parties other than Homes.com. All information provided is deemed reliable, but is not guaranteed to be accurate and should be independently verified.
![]() The data relating to real estate for sale on this website appears in part through the BRIGHT Internet Data Exchange program, a voluntary cooperative exchange of property listing data between licensed real estate brokerage firms, and is provided by BRIGHT through a licensing agreement.
The data relating to real estate for sale on this website appears in part through the BRIGHT Internet Data Exchange program, a voluntary cooperative exchange of property listing data between licensed real estate brokerage firms, and is provided by BRIGHT through a licensing agreement.
Listing information is from various brokers who participate in the Bright MLS IDX program and not all listings may be visible on the site.
The property information being provided on or through the website is for the personal, non-commercial use of consumers and such information may not be used for any purpose other than to identify prospective properties consumers may be interested in purchasing.
Some properties which appear for sale on the website may no longer be available because they are for instance, under contract, sold or are no longer being offered for sale.
Property information displayed is deemed reliable but is not guaranteed.
Copyright 2025 Bright MLS, Inc.