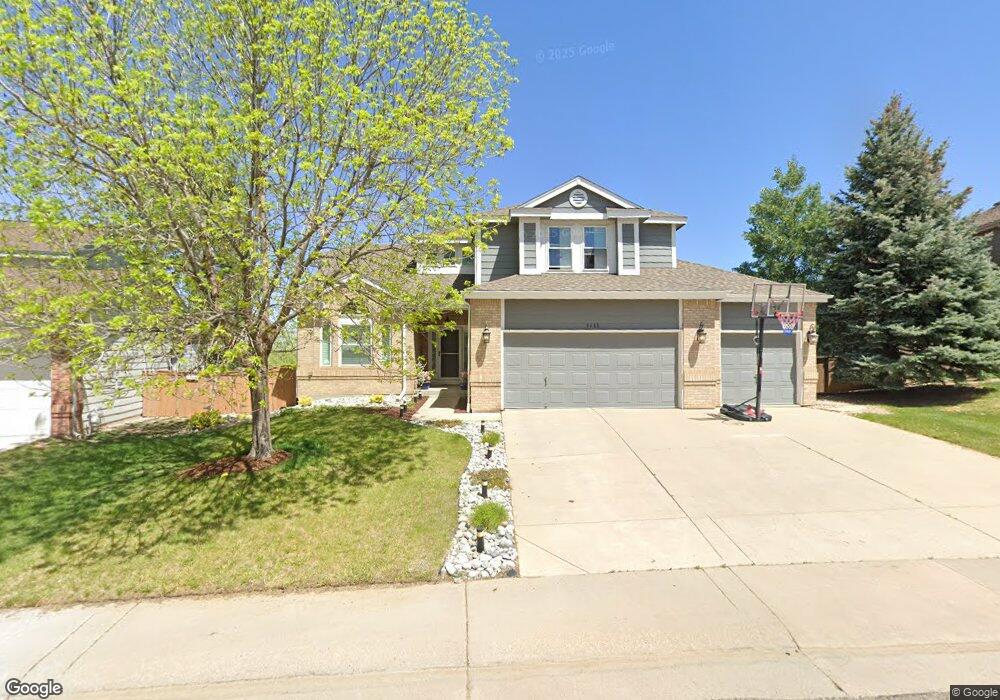
5455 Knoll Place Highlands Ranch, CO 80130
Southridge NeighborhoodEstimated Value: $894,463 - $1,022,000
4
Beds
3
Baths
4,332
Sq Ft
$217/Sq Ft
Est. Value
About This Home
This home is located at 5455 Knoll Place, Highlands Ranch, CO 80130 and is currently estimated at $941,866, approximately $217 per square foot. 5455 Knoll Place is a home located in Douglas County with nearby schools including Redstone Elementary School, Rocky Heights Middle School, and Rock Canyon High School.
Ownership History
Date
Name
Owned For
Owner Type
Purchase Details
Closed on
Jun 21, 2021
Sold by
Sheldon Gregory J and Sheldon Megan G
Bought by
Gregory J Sheldon Revocable Trust
Current Estimated Value
Purchase Details
Closed on
Jan 4, 2019
Sold by
Lenertz Wayne A and Lenertz Desiree J
Bought by
Sheldon Gregory J and Sheldon Megan G
Home Financials for this Owner
Home Financials are based on the most recent Mortgage that was taken out on this home.
Original Mortgage
$527,200
Interest Rate
4.8%
Mortgage Type
New Conventional
Purchase Details
Closed on
Mar 4, 2016
Sold by
Richman Sara A and Richman David S
Bought by
Lenertz Wayne A and Lenertz Desiree J
Home Financials for this Owner
Home Financials are based on the most recent Mortgage that was taken out on this home.
Original Mortgage
$428,000
Interest Rate
3.81%
Mortgage Type
New Conventional
Purchase Details
Closed on
Jul 24, 2006
Sold by
Deckerman Robert W and Deckerman Julie C
Bought by
Richman Sara A and Richman David S
Home Financials for this Owner
Home Financials are based on the most recent Mortgage that was taken out on this home.
Original Mortgage
$392,000
Interest Rate
6.62%
Mortgage Type
Unknown
Purchase Details
Closed on
Sep 24, 1999
Sold by
Deckerman Julie C and Deckerman Robert W
Bought by
Deckerman Robert W and Deckerman Julie C
Purchase Details
Closed on
Nov 23, 1998
Sold by
Deckerman Robert W Deckerman Julie C
Bought by
Deckerman Julie C
Home Financials for this Owner
Home Financials are based on the most recent Mortgage that was taken out on this home.
Original Mortgage
$246,400
Interest Rate
6.81%
Purchase Details
Closed on
Nov 11, 1998
Sold by
Deckerman Robert W and Deckerman Julie C
Bought by
Deckerman Julie C
Home Financials for this Owner
Home Financials are based on the most recent Mortgage that was taken out on this home.
Original Mortgage
$246,400
Interest Rate
6.81%
Purchase Details
Closed on
Nov 27, 1996
Sold by
Richmond Homes Inc Ii
Bought by
Deckerman Robert W and Deckerman Julie C
Home Financials for this Owner
Home Financials are based on the most recent Mortgage that was taken out on this home.
Original Mortgage
$246,400
Interest Rate
7.85%
Create a Home Valuation Report for This Property
The Home Valuation Report is an in-depth analysis detailing your home's value as well as a comparison with similar homes in the area
Home Values in the Area
Average Home Value in this Area
Purchase History
| Date | Buyer | Sale Price | Title Company |
|---|---|---|---|
| Gregory J Sheldon Revocable Trust | -- | None Available | |
| Sheldon Gregory J | $659,000 | None Available | |
| Lenertz Wayne A | $535,000 | Heritage Title Co | |
| Richman Sara A | $490,000 | Land Title | |
| Deckerman Robert W | -- | -- | |
| Deckerman Julie C | -- | -- | |
| Deckerman Julie C Deckerman Robert W | -- | -- | |
| Deckerman Julie C | -- | -- | |
| Deckerman Julie C | -- | -- | |
| Deckerman Robert W | $259,378 | Land Title |
Source: Public Records
Mortgage History
| Date | Status | Borrower | Loan Amount |
|---|---|---|---|
| Previous Owner | Sheldon Gregory J | $527,200 | |
| Previous Owner | Lenertz Wayne A | $428,000 | |
| Previous Owner | Richman Sara A | $392,000 | |
| Previous Owner | Deckerman Julie C | $246,400 | |
| Previous Owner | Deckerman Robert W | $246,400 |
Source: Public Records
Tax History Compared to Growth
Tax History
| Year | Tax Paid | Tax Assessment Tax Assessment Total Assessment is a certain percentage of the fair market value that is determined by local assessors to be the total taxable value of land and additions on the property. | Land | Improvement |
|---|---|---|---|---|
| 2024 | $5,691 | $64,060 | $13,560 | $50,500 |
| 2023 | $5,681 | $64,060 | $13,560 | $50,500 |
| 2022 | $4,154 | $45,470 | $9,860 | $35,610 |
| 2021 | $4,321 | $45,470 | $9,860 | $35,610 |
| 2020 | $4,023 | $43,380 | $9,930 | $33,450 |
| 2019 | $4,038 | $43,380 | $9,930 | $33,450 |
| 2018 | $3,879 | $41,040 | $9,580 | $31,460 |
| 2017 | $3,532 | $41,040 | $9,580 | $31,460 |
| 2016 | $3,579 | $40,820 | $9,450 | $31,370 |
| 2015 | $3,656 | $40,820 | $9,450 | $31,370 |
| 2014 | $3,361 | $34,650 | $8,420 | $26,230 |
Source: Public Records
Map
Nearby Homes
- 5632 Tory Pointe
- 10078 Apollo Bay Way
- 10278 Dan Ct
- 10292 Nickolas Ave
- 4907 Fenwood Dr
- 10439 Cheetah Winds
- 4967 Waldenwood Dr
- 10445 Cheetah Winds
- 4925 Kingston Ave
- 4931 Waldenwood Dr
- 4848 Fenwood Dr
- 10296 Lauren Ct
- 4749 Waldenwood Dr
- 9720 Sydney Ln
- 9735 Queenscliffe Dr
- 10360 Tracewood Ct
- 5639 Jaguar Way
- 10497 Wagon Box Cir
- 10048 Brisbane Way
- 9744 Townsville Cir
- 5465 Knoll Place
- 5445 Knoll Place
- 5435 Knoll Place
- 5475 Knoll Place
- 5446 Knoll Place
- 10123 Knoll Cir
- 10083 Matthew Ln
- 5425 Knoll Place
- 10119 Knoll Cir
- 10129 Knoll Cir
- 5426 E Knoll Place
- 5426 Knoll Place
- 10080 Matthew Ln
- 10135 Knoll Cir
- 10075 Matthew Ln
- 10111 Knoll Cir
- 5415 Knoll Place
- 10116 Knoll Cir
- 10139 Knoll Cir
- 5416 Knoll Place