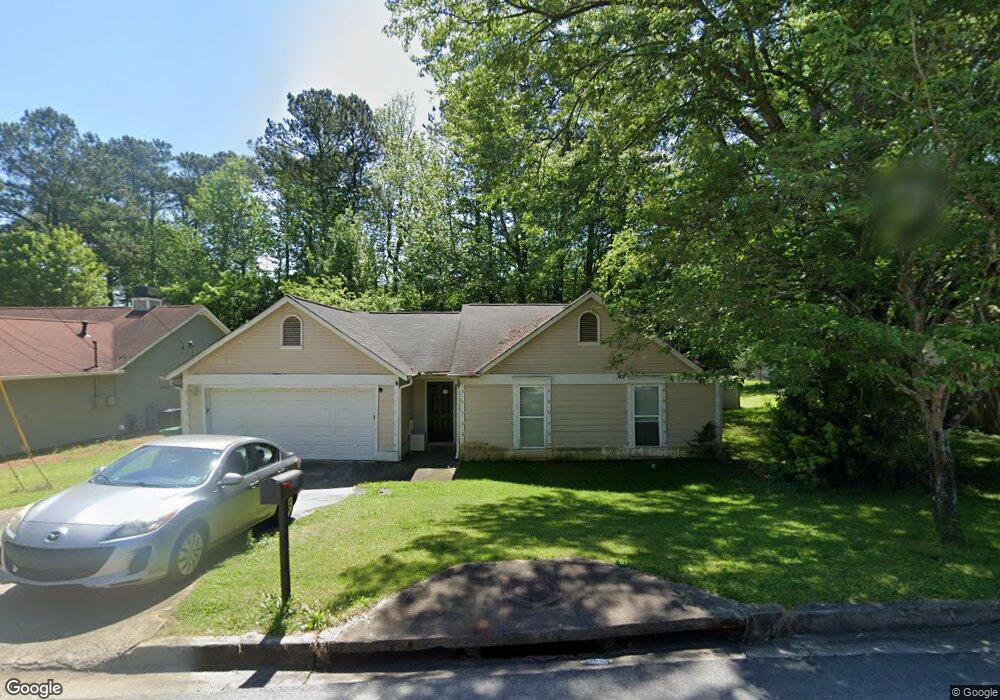
5456 Panola Downs Rd Lithonia, GA 30058
Estimated Value: $202,206 - $233,000
3
Beds
2
Baths
1,216
Sq Ft
$178/Sq Ft
Est. Value
About This Home
This home is located at 5456 Panola Downs Rd, Lithonia, GA 30058 and is currently estimated at $217,052, approximately $178 per square foot. 5456 Panola Downs Rd is a home located in DeKalb County with nearby schools including Panola Way Elementary School, Miller Grove Middle School, and Miller Grove High School.
Ownership History
Date
Name
Owned For
Owner Type
Purchase Details
Closed on
Jun 18, 2020
Sold by
Baf 1 Llc
Bought by
Baf Assets Llc
Current Estimated Value
Purchase Details
Closed on
Aug 24, 2018
Sold by
Jeff 1 Llc
Bought by
Baf 1 Llc
Purchase Details
Closed on
Mar 3, 2017
Sold by
Mupr 3 Assets Llc
Bought by
Broadtree Homes Georgia Ii Llc
Purchase Details
Closed on
Aug 2, 2016
Sold by
Dale
Bought by
Unity Realty Co
Purchase Details
Closed on
Oct 26, 2007
Sold by
Joseph Mahaley Gen Ptshp
Bought by
King Dale
Home Financials for this Owner
Home Financials are based on the most recent Mortgage that was taken out on this home.
Original Mortgage
$111,000
Interest Rate
6.27%
Mortgage Type
New Conventional
Purchase Details
Closed on
Jun 5, 2007
Sold by
Rhome Rebecca
Bought by
Mahaley Joseph
Purchase Details
Closed on
Sep 27, 1999
Sold by
Secretary
Bought by
Rhome Rebecca
Home Financials for this Owner
Home Financials are based on the most recent Mortgage that was taken out on this home.
Original Mortgage
$75,600
Interest Rate
7.91%
Mortgage Type
FHA
Create a Home Valuation Report for This Property
The Home Valuation Report is an in-depth analysis detailing your home's value as well as a comparison with similar homes in the area
Home Values in the Area
Average Home Value in this Area
Purchase History
| Date | Buyer | Sale Price | Title Company |
|---|---|---|---|
| Baf Assets Llc | $160,256 | -- | |
| Baf 1 Llc | $130,394 | -- | |
| Broadtree Homes Georgia Ii Llc | $92,889 | -- | |
| Unity Realty Co | $54,000 | -- | |
| Hsbc Bank Usa | $54,000 | -- | |
| King Dale | $111,000 | -- | |
| Mahaley Joseph | $75,175 | -- | |
| Rhome Rebecca | -- | -- |
Source: Public Records
Mortgage History
| Date | Status | Borrower | Loan Amount |
|---|---|---|---|
| Previous Owner | King Dale | $111,000 | |
| Previous Owner | Rhome Rebecca | $75,600 |
Source: Public Records
Tax History Compared to Growth
Tax History
| Year | Tax Paid | Tax Assessment Tax Assessment Total Assessment is a certain percentage of the fair market value that is determined by local assessors to be the total taxable value of land and additions on the property. | Land | Improvement |
|---|---|---|---|---|
| 2025 | $4,165 | $85,000 | $16,150 | $68,850 |
| 2024 | $4,162 | $85,000 | $16,000 | $69,000 |
| 2023 | $4,162 | $85,000 | $16,000 | $69,000 |
| 2022 | $2,354 | $45,920 | $7,200 | $38,720 |
| 2021 | $2,354 | $45,920 | $7,200 | $38,720 |
| 2020 | $1,985 | $45,920 | $7,200 | $38,720 |
| 2019 | $1,985 | $37,520 | $7,200 | $30,320 |
| 2018 | $1,595 | $32,160 | $7,200 | $24,960 |
| 2017 | $1,504 | $26,440 | $3,480 | $22,960 |
| 2016 | $1,434 | $24,800 | $3,480 | $21,320 |
| 2014 | $1,422 | $23,920 | $3,480 | $20,440 |
Source: Public Records
Map
Nearby Homes
- 5474 Panola Downs Rd
- 5477 Forest Pines Dr
- 5427 Forest Pines Dr
- 5541 Panola Place
- 5498 Marbut Forest Ct
- 2123 Panola Rd
- 5570 Downs Way
- 5490 Marbut Rd
- 2026 Mallard Crest
- 5455 Wood Duck Ln
- 5595 Marbut Rd
- 2169 Panola Rd
- 5578 Marbut Rd
- 5323 Scarbrough Round
- 5445 Mallard Trail Unit 1
- 5350 Olde St
- 1946 Taffeta Trail
- 5509 Covent Way
- 1841 Northwick Place
- 5344 Brooklands Dr
- 5460 Panola Downs Rd
- 2020 Downs Place
- 2024 Downs Place Unit 1
- 2024 Downs Place
- 2050 Downs Place
- 5468 Panola Downs Rd
- 2032 Downs Place
- 2008 Downs Place
- 2042 Downs Place
- 2042 Downs Place
- 2054 Downs Place
- 5457 Panola Downs Rd
- 2000 Downs Place
- 5461 Panola Downs Rd
- 5478 Downs Way
- 2019 Downs Place Unit 1
- 5465 Panola Downs Rd
- 5480 Panola Downs Rd Unit 16
- 2009 Downs Place
- 5469 Panola Downs Rd