Estimated Value: $238,000 - $313,000
3
Beds
2
Baths
1,680
Sq Ft
$164/Sq Ft
Est. Value
About This Home
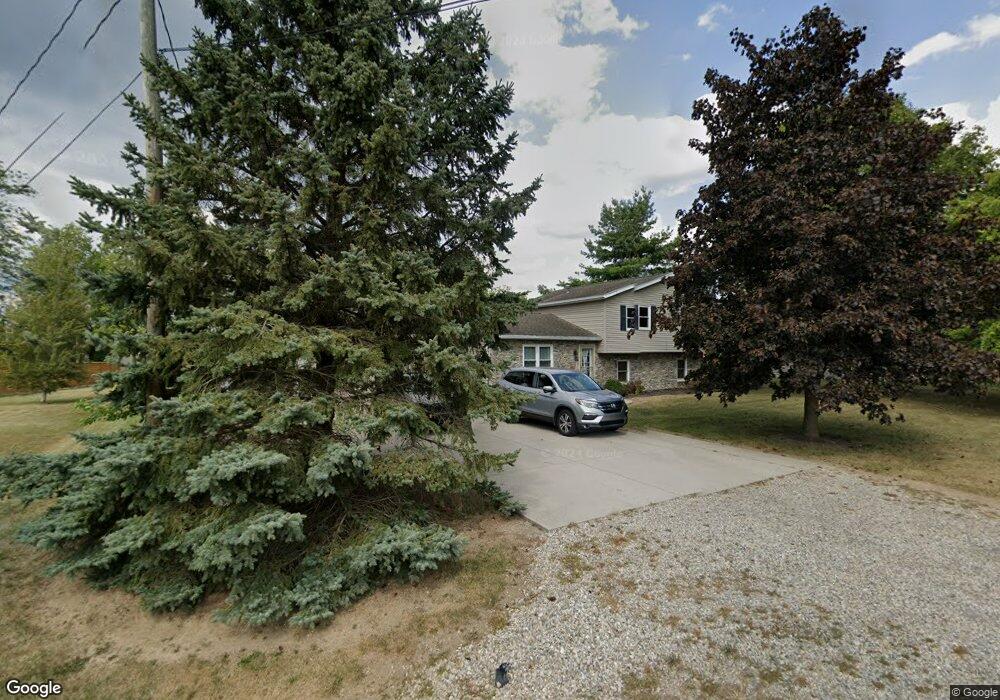
This home is located at 5456 Poling Rd, Lima, OH 45807 and is currently estimated at $274,953, approximately $163 per square foot. 5456 Poling Rd is a home located in Allen County with nearby schools including Elida Elementary School, Elida Middle School, and Elida High School.
Ownership History
Date
Name
Owned For
Owner Type
Purchase Details
Closed on
Nov 22, 2011
Sold by
Harsh Alexis and Harsh Tim L
Bought by
Lackey Eric A
Current Estimated Value
Home Financials for this Owner
Home Financials are based on the most recent Mortgage that was taken out on this home.
Original Mortgage
$145,053
Outstanding Balance
$99,198
Interest Rate
4.08%
Mortgage Type
VA
Estimated Equity
$175,755
Purchase Details
Closed on
Aug 2, 2002
Sold by
Rase Ryan K
Bought by
Harsh Alexis and Harsh Tim
Home Financials for this Owner
Home Financials are based on the most recent Mortgage that was taken out on this home.
Original Mortgage
$111,150
Interest Rate
6.7%
Mortgage Type
New Conventional
Purchase Details
Closed on
Sep 1, 1998
Sold by
Johns Joe
Bought by
Custer Ryan Rase Jamie
Home Financials for this Owner
Home Financials are based on the most recent Mortgage that was taken out on this home.
Original Mortgage
$94,500
Interest Rate
7.03%
Mortgage Type
New Conventional
Purchase Details
Closed on
Dec 29, 1988
Bought by
Johns Joe M
Create a Home Valuation Report for This Property
The Home Valuation Report is an in-depth analysis detailing your home's value as well as a comparison with similar homes in the area
Home Values in the Area
Average Home Value in this Area
Purchase History
| Date | Buyer | Sale Price | Title Company |
|---|---|---|---|
| Lackey Eric A | $142,000 | None Available | |
| Harsh Alexis | $117,000 | -- | |
| Custer Ryan Rase Jamie | $105,000 | -- | |
| Johns Joe M | $76,000 | -- |
Source: Public Records
Mortgage History
| Date | Status | Borrower | Loan Amount |
|---|---|---|---|
| Open | Lackey Eric A | $145,053 | |
| Previous Owner | Harsh Alexis | $111,150 | |
| Previous Owner | Custer Ryan Rase Jamie | $94,500 |
Source: Public Records
Tax History Compared to Growth
Tax History
| Year | Tax Paid | Tax Assessment Tax Assessment Total Assessment is a certain percentage of the fair market value that is determined by local assessors to be the total taxable value of land and additions on the property. | Land | Improvement |
|---|---|---|---|---|
| 2024 | $3,102 | $71,540 | $10,010 | $61,530 |
| 2023 | $2,521 | $51,840 | $7,250 | $44,590 |
| 2022 | $2,572 | $51,840 | $7,250 | $44,590 |
| 2021 | $2,585 | $51,840 | $7,250 | $44,590 |
| 2020 | $2,410 | $44,870 | $6,860 | $38,010 |
| 2019 | $2,410 | $44,870 | $6,860 | $38,010 |
| 2018 | $2,427 | $44,870 | $6,860 | $38,010 |
| 2017 | $2,084 | $39,900 | $6,860 | $33,040 |
| 2016 | $2,084 | $39,900 | $6,860 | $33,040 |
| 2015 | $2,096 | $39,900 | $6,860 | $33,040 |
| 2014 | $2,160 | $39,660 | $7,140 | $32,520 |
| 2013 | $1,940 | $39,660 | $7,140 | $32,520 |
Source: Public Records
Map
Nearby Homes
- 5825 Poling Rd
- 1734 Woodberry Creek Dr
- 1784 Woodberry Creek Dr
- 5280 Lobo St
- 5103 Hummingbird St
- 4901 Hummingbird St
- 5126 Pheasant St
- 4917 Pheasant St
- 2733 Lilly Dr
- 0000 Baty Rd
- 1393 N Stevick Rd
- 4540 East Rd
- 200 Fraunfelter Rd S
- 2922 Dutch Hollow Rd
- 251 Timberfield Dr N
- 2048 Morning Glory Dr
- 00 Allentown Rd
- 0 Allentown Rd
- 3948 Chestnut Oak Trail
- 4723 Amaryllis St
- 5440 Poling Rd
- 1505 N Wapakoneta Rd
- 5480 Poling Rd
- 1401 N Wapakoneta Rd
- 1401 N Wapak Rd
- 5475 Poling Rd
- 1513 N Wapakoneta Rd
- 5459 Quince Ct
- 5495 Poling Rd
- 5433 Poling Rd
- 5515 Poling Rd
- 5441 Quince Ct
- 5423 Poling Rd
- 5477 Quince Ct
- 5535 Poling Rd
- 1525 N Wapak Rd
- 1525 N Wapakoneta Rd
- 5478 Quince Ct
- 5545 Poling Rd