Estimated Value: $156,000 - $165,430
2
Beds
2
Baths
950
Sq Ft
$169/Sq Ft
Est. Value
About This Home
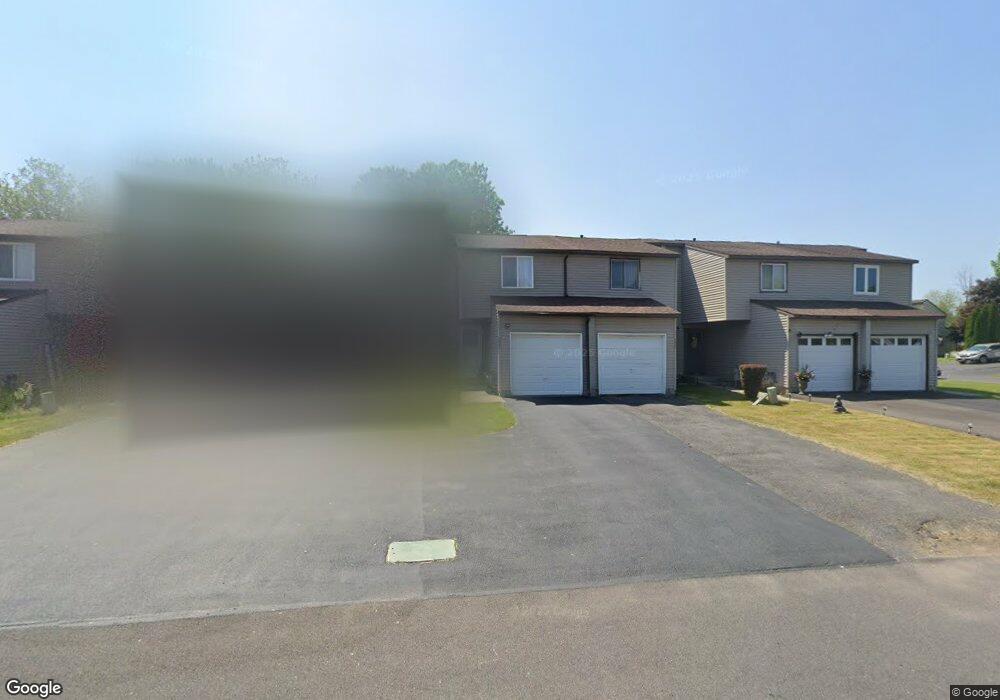
This home is located at 5457 Borgase Ln Unit 5457, Clay, NY 13041 and is currently estimated at $160,858, approximately $169 per square foot. 5457 Borgase Ln Unit 5457 is a home located in Onondaga County with nearby schools including North Syracuse Junior High School and Cicero North Syracuse High School.
Ownership History
Date
Name
Owned For
Owner Type
Purchase Details
Closed on
Jun 13, 2022
Sold by
Doney Nataliya
Bought by
Rastellini Terese L
Current Estimated Value
Home Financials for this Owner
Home Financials are based on the most recent Mortgage that was taken out on this home.
Original Mortgage
$85,000
Outstanding Balance
$80,878
Interest Rate
5.27%
Mortgage Type
Purchase Money Mortgage
Estimated Equity
$79,980
Purchase Details
Closed on
Sep 10, 2014
Sold by
Masnyy Viktor
Bought by
Galasa Nataliya
Home Financials for this Owner
Home Financials are based on the most recent Mortgage that was taken out on this home.
Original Mortgage
$60,000
Interest Rate
4.12%
Mortgage Type
Purchase Money Mortgage
Purchase Details
Closed on
Jul 21, 2009
Sold by
Harmon Christopher
Bought by
Masnyy Viktor
Purchase Details
Closed on
Jun 27, 2007
Sold by
Commisso James A
Bought by
Harmon Christopher
Create a Home Valuation Report for This Property
The Home Valuation Report is an in-depth analysis detailing your home's value as well as a comparison with similar homes in the area
Home Values in the Area
Average Home Value in this Area
Purchase History
| Date | Buyer | Sale Price | Title Company |
|---|---|---|---|
| Rastellini Terese L | $115,000 | None Available | |
| Galasa Nataliya | $75,000 | Neil Germian | |
| Masnyy Viktor | $75,000 | Thad Sondej | |
| Harmon Christopher | $28,700 | Peter Panels |
Source: Public Records
Mortgage History
| Date | Status | Borrower | Loan Amount |
|---|---|---|---|
| Open | Rastellini Terese L | $85,000 | |
| Previous Owner | Galasa Nataliya | $60,000 |
Source: Public Records
Tax History Compared to Growth
Tax History
| Year | Tax Paid | Tax Assessment Tax Assessment Total Assessment is a certain percentage of the fair market value that is determined by local assessors to be the total taxable value of land and additions on the property. | Land | Improvement |
|---|---|---|---|---|
| 2024 | $2,559 | $3,000 | $600 | $2,400 |
| 2023 | $3,484 | $3,000 | $600 | $2,400 |
| 2022 | $3,549 | $3,000 | $600 | $2,400 |
| 2021 | $3,515 | $3,000 | $600 | $2,400 |
| 2020 | $2,643 | $3,000 | $600 | $2,400 |
| 2019 | $1,540 | $3,000 | $600 | $2,400 |
| 2018 | $2,516 | $3,000 | $600 | $2,400 |
| 2017 | $1,483 | $3,000 | $600 | $2,400 |
| 2016 | $2,417 | $3,000 | $600 | $2,400 |
| 2015 | -- | $3,000 | $600 | $2,400 |
| 2014 | -- | $3,000 | $600 | $2,400 |
Source: Public Records
Map
Nearby Homes
- 5423 Borgase Ln
- 5382 Tourmaline Dr
- 8248 Trevi Ln
- 8129 Firenze Ln
- 5547 Rockhampton Path
- 8133 Duncowing Ln
- 8050 Evesborough Dr
- 5471 Lucknow Dr
- 8177 Avoss Ln
- 8084 Bamm Hollow Rd
- 8112 Weblank Way
- 5370 Vineyard Dr
- 5352 Vineyard Dr
- 5513 Trastevere Rd
- 8179 Rizzo Dr
- 8201 Lawton Rd
- 0 Lawton Rd Unit S1581233
- 8050 Lucas Dr Unit B
- 5245 Potenza Dr
- 8010 Casilina Dr
- 5457 Borgase Ln
- 5459 Borgase Ln
- 5455 Borgase Ln
- 5461 Borgase Ln
- 5453 Borgase Ln
- 5453 Borgase Ln
- 5451 Borgase Ln
- 5463 Borgase Ln
- 5449 Borgase Ln
- 8291 Mantova Dr
- 5447 Borgase Ln
- 5445 Borgase Ln
- 8293 Mantova Dr
- 5443 Borgase Ln
- 8312 Trevi Ln
- 8310 Trevi Ln
- 8308 Trevi Ln
- 8314 Trevi Ln
- 8306 Trevi Ln
- 5456 Borgase Ln