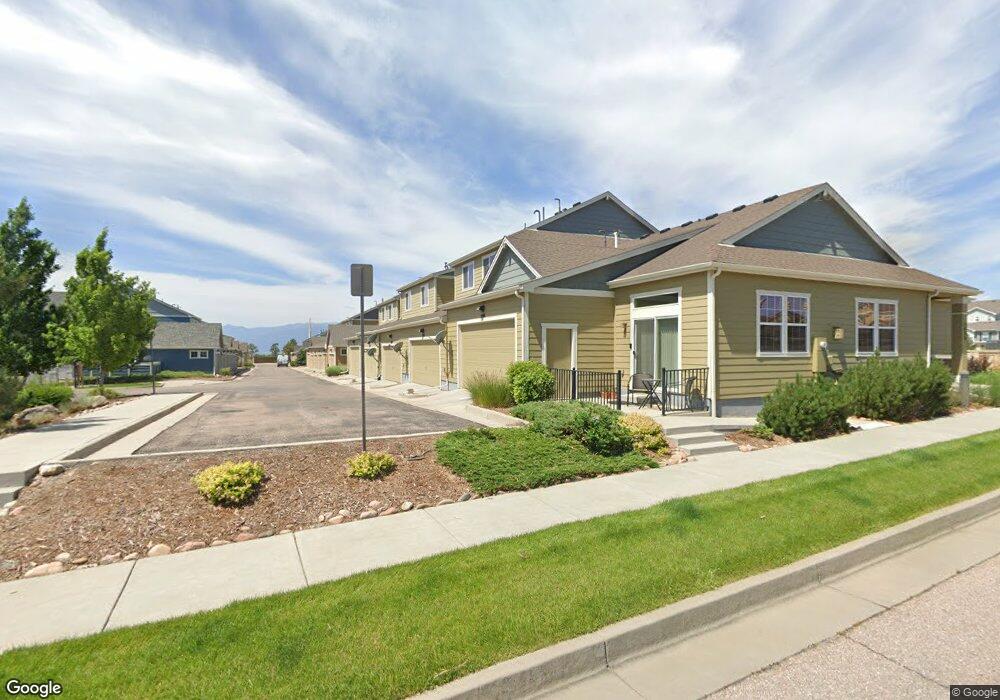
5458 Jordy Russ Grove Colorado Springs, CO 80924
Wolf Ranch NeighborhoodEstimated Value: $357,452 - $367,000
2
Beds
3
Baths
1,373
Sq Ft
$264/Sq Ft
Est. Value
About This Home
This home is located at 5458 Jordy Russ Grove, Colorado Springs, CO 80924 and is currently estimated at $362,613, approximately $264 per square foot. 5458 Jordy Russ Grove is a home located in El Paso County with nearby schools including Legacy Peak Elementary School, Chinook Trail Middle School, and Liberty High School.
Ownership History
Date
Name
Owned For
Owner Type
Purchase Details
Closed on
Aug 26, 2022
Sold by
Ryan Wehner
Bought by
Ochs Jeremy
Current Estimated Value
Home Financials for this Owner
Home Financials are based on the most recent Mortgage that was taken out on this home.
Original Mortgage
$199,900
Outstanding Balance
$191,372
Interest Rate
5.51%
Mortgage Type
New Conventional
Estimated Equity
$171,241
Purchase Details
Closed on
Dec 11, 2020
Sold by
Suarez Delia
Bought by
Wehner Ryan
Home Financials for this Owner
Home Financials are based on the most recent Mortgage that was taken out on this home.
Original Mortgage
$265,000
Interest Rate
2.8%
Mortgage Type
New Conventional
Purchase Details
Closed on
May 30, 2012
Sold by
The Overlook At Wolf Ranch Llc
Bought by
Saurez Delia
Home Financials for this Owner
Home Financials are based on the most recent Mortgage that was taken out on this home.
Original Mortgage
$194,487
Interest Rate
3.9%
Mortgage Type
VA
Create a Home Valuation Report for This Property
The Home Valuation Report is an in-depth analysis detailing your home's value as well as a comparison with similar homes in the area
Home Values in the Area
Average Home Value in this Area
Purchase History
| Date | Buyer | Sale Price | Title Company |
|---|---|---|---|
| Ochs Jeremy | $379,900 | None Listed On Document | |
| Wehner Ryan | $295,000 | Land Title Guarantee Company | |
| Saurez Delia | $189,929 | Land Title Guarantee Company |
Source: Public Records
Mortgage History
| Date | Status | Borrower | Loan Amount |
|---|---|---|---|
| Open | Ochs Jeremy | $199,900 | |
| Previous Owner | Wehner Ryan | $265,000 | |
| Previous Owner | Saurez Delia | $194,487 |
Source: Public Records
Tax History Compared to Growth
Tax History
| Year | Tax Paid | Tax Assessment Tax Assessment Total Assessment is a certain percentage of the fair market value that is determined by local assessors to be the total taxable value of land and additions on the property. | Land | Improvement |
|---|---|---|---|---|
| 2025 | $1,857 | $25,550 | -- | -- |
| 2024 | $1,798 | $24,540 | $5,360 | $19,180 |
| 2023 | $1,798 | $24,540 | $5,360 | $19,180 |
| 2022 | $1,738 | $18,790 | $3,480 | $15,310 |
| 2021 | $1,876 | $19,330 | $3,580 | $15,750 |
| 2020 | $1,771 | $17,260 | $2,680 | $14,580 |
| 2019 | $1,756 | $17,260 | $2,680 | $14,580 |
| 2018 | $1,497 | $14,540 | $2,300 | $12,240 |
| 2017 | $1,492 | $14,540 | $2,300 | $12,240 |
| 2016 | $1,435 | $14,310 | $2,230 | $12,080 |
| 2015 | $1,433 | $14,310 | $2,230 | $12,080 |
| 2014 | $1,376 | $13,730 | $2,230 | $11,500 |
Source: Public Records
Map
Nearby Homes
- 8760 Eckberg Heights
- 8728 Eckberg Heights
- 5426 Cushing Grove
- 5414 Cushing Grove
- 5408 Cushing Grove
- 8688 Eckberg Heights
- 5060 Mountain Vista Heights
- 8952 Tutt Blvd
- 9426 Wolf Valley Dr
- 9484 Simper Heights
- 9436 Wolf Valley Dr
- 5654 Cisco Dr
- 8405 Andrus Dr
- 5718 Paladin Place
- 9033 Kennebec Pass Trail
- 8352 James Creek Dr
- 7543 Potomac Dr
- The Everest Plan at The Townes at Cumbre Vista
- The Denali Plan at The Townes at Cumbre Vista
- The Elbrus Plan at The Townes at Cumbre Vista
- 5454 Jordy Russ Grove
- 5462 Jordy Russ Grove
- 5450 Jordy Russ Grove
- 5466 Jordy Russ Grove
- 5446 Jordy Russ Grove
- 5481 Cross Creek Dr
- 5442 Jordy Russ Grove
- 5460 Smokey Heights
- 5485 Cross Creek Dr
- 5438 Jordy Russ Grove
- 5454 Smokey Heights
- 5489 Cross Creek Dr
- 5434 Jordy Russ Grove
- 5448 Smokey Heights
- 5493 Cross Creek Dr
- 5430 Jordy Russ Grove
- 5442 Smokey Heights
- 5497 Cross Creek Dr
- 5436 Smokey Heights
- 5505 Prima Ln