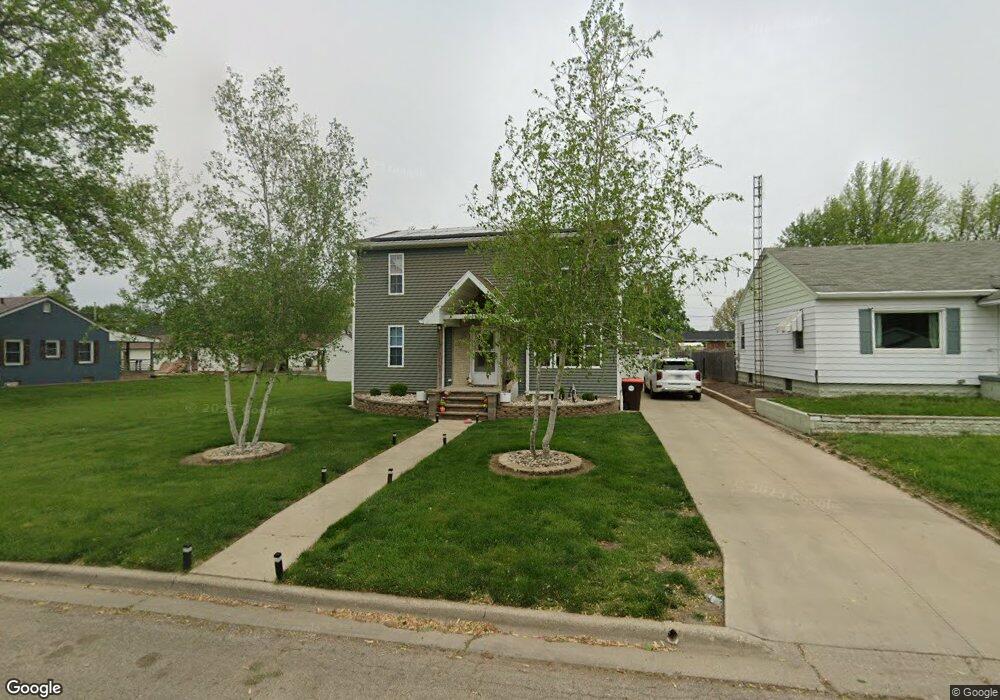
546 10th St Lincoln, IL 62656
Estimated Value: $181,000 - $235,000
--
Bed
--
Bath
--
Sq Ft
9,583
Sq Ft Lot
About This Home
This home is located at 546 10th St, Lincoln, IL 62656 and is currently estimated at $215,384. 546 10th St is a home located in Logan County with nearby schools including Northwest Elementary School, Lincoln Junior High School, and Lincoln Community High School.
Ownership History
Date
Name
Owned For
Owner Type
Purchase Details
Closed on
Jun 28, 2022
Sold by
Cooper Marsha
Bought by
Cooper Marsha and Vinyard Kenna
Current Estimated Value
Purchase Details
Closed on
Jul 1, 2021
Sold by
Vinyard Darren C
Bought by
Cooper Marsha
Home Financials for this Owner
Home Financials are based on the most recent Mortgage that was taken out on this home.
Original Mortgage
$155,800
Interest Rate
2.9%
Mortgage Type
New Conventional
Purchase Details
Closed on
Aug 11, 2010
Sold by
Riecks Natalie S and Logan Sara O
Bought by
Vinyard Darren C
Home Financials for this Owner
Home Financials are based on the most recent Mortgage that was taken out on this home.
Original Mortgage
$30,000
Interest Rate
4.45%
Mortgage Type
Future Advance Clause Open End Mortgage
Create a Home Valuation Report for This Property
The Home Valuation Report is an in-depth analysis detailing your home's value as well as a comparison with similar homes in the area
Home Values in the Area
Average Home Value in this Area
Purchase History
| Date | Buyer | Sale Price | Title Company |
|---|---|---|---|
| Cooper Marsha | -- | None Available | |
| Cooper Marsha | $164,000 | None Available | |
| Vinyard Darren C | $4,500 | -- |
Source: Public Records
Mortgage History
| Date | Status | Borrower | Loan Amount |
|---|---|---|---|
| Previous Owner | Cooper Marsha | $155,800 | |
| Previous Owner | Vinyard Darren C | $30,000 |
Source: Public Records
Tax History Compared to Growth
Tax History
| Year | Tax Paid | Tax Assessment Tax Assessment Total Assessment is a certain percentage of the fair market value that is determined by local assessors to be the total taxable value of land and additions on the property. | Land | Improvement |
|---|---|---|---|---|
| 2024 | $4,866 | $59,800 | $7,660 | $52,140 |
| 2023 | $4,604 | $55,370 | $7,090 | $48,280 |
| 2022 | $4,438 | $51,630 | $6,610 | $45,020 |
| 2021 | $4,266 | $49,710 | $6,360 | $43,350 |
| 2020 | $4,274 | $49,710 | $6,360 | $43,350 |
| 2019 | $4,173 | $48,742 | $6,240 | $42,502 |
| 2018 | $4,590 | $52,420 | $6,000 | $46,420 |
| 2017 | $4,565 | $52,420 | $6,000 | $46,420 |
| 2016 | $4,511 | $53,030 | $6,070 | $46,960 |
| 2015 | $1,018 | $51,180 | $5,850 | $45,330 |
| 2014 | $1,018 | $51,180 | $5,850 | $45,330 |
| 2013 | $1,018 | $47,230 | $5,400 | $41,830 |
| 2012 | $1,018 | $10,190 | $5,480 | $4,710 |
Source: Public Records
Map
Nearby Homes
- 319 N Adams St
- 454 8th St
- 455 8th St
- 617 Short 8th St
- 204 9th St
- 201 S College St
- 510 16th St Unit 512
- 184 9th St
- 424 N Jefferson St
- 923 & 925 N Adams St
- 710 N Jefferson St
- 440 5th St
- 1118 6th St
- 306 Woodlawn Rd
- 417 N Union St
- 912 Woodlawn Rd
- 104 Tremont St
- 1020 N Postville Dr Unit 1050
- 228 4th St
- 1102 3rd St