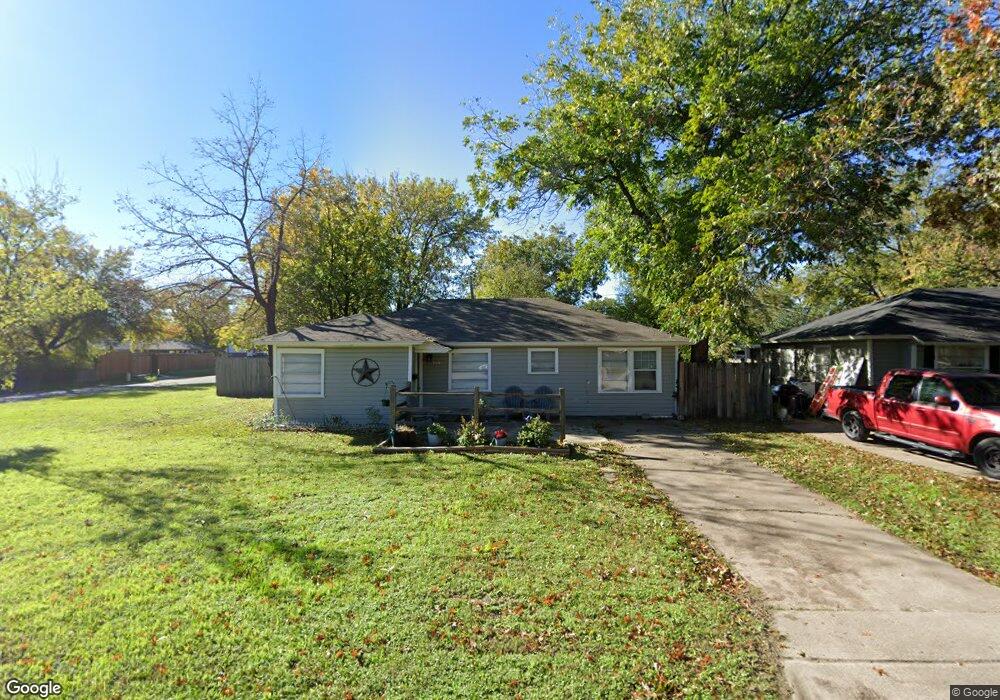
546 Cimarron Trace Grand Prairie, TX 75051
Estimated Value: $225,000 - $258,046
3
Beds
1
Bath
1,118
Sq Ft
$220/Sq Ft
Est. Value
About This Home
This home is located at 546 Cimarron Trace, Grand Prairie, TX 75051 and is currently estimated at $245,512, approximately $219 per square foot. 546 Cimarron Trace is a home located in Dallas County with nearby schools including James Bowie Fine Arts Academy, Crosswinds High School, and Young Men's Leadership Academy at Kennedy Middle School.
Ownership History
Date
Name
Owned For
Owner Type
Purchase Details
Closed on
Jul 26, 2019
Sold by
The Boltz Family Limited Partnership
Bought by
Preston Lee Parkway Llc
Current Estimated Value
Home Financials for this Owner
Home Financials are based on the most recent Mortgage that was taken out on this home.
Original Mortgage
$60,000
Interest Rate
3.8%
Mortgage Type
Purchase Money Mortgage
Purchase Details
Closed on
Aug 25, 2005
Sold by
Deal Foyil Edward
Bought by
Henry Christopher M
Home Financials for this Owner
Home Financials are based on the most recent Mortgage that was taken out on this home.
Original Mortgage
$71,400
Interest Rate
5.78%
Mortgage Type
Purchase Money Mortgage
Purchase Details
Closed on
Nov 19, 2001
Sold by
Peace Patrick E
Bought by
Deal Foyil Edward
Create a Home Valuation Report for This Property
The Home Valuation Report is an in-depth analysis detailing your home's value as well as a comparison with similar homes in the area
Home Values in the Area
Average Home Value in this Area
Purchase History
| Date | Buyer | Sale Price | Title Company |
|---|---|---|---|
| Preston Lee Parkway Llc | -- | Wfg National Title Company | |
| Henry Christopher M | -- | Ctic | |
| Deal Foyil Edward | -- | -- |
Source: Public Records
Mortgage History
| Date | Status | Borrower | Loan Amount |
|---|---|---|---|
| Closed | Preston Lee Parkway Llc | $60,000 | |
| Previous Owner | Henry Christopher M | $71,400 |
Source: Public Records
Tax History Compared to Growth
Tax History
| Year | Tax Paid | Tax Assessment Tax Assessment Total Assessment is a certain percentage of the fair market value that is determined by local assessors to be the total taxable value of land and additions on the property. | Land | Improvement |
|---|---|---|---|---|
| 2025 | $5,160 | $230,260 | $45,000 | $185,260 |
| 2024 | $5,160 | $229,260 | $45,000 | $184,260 |
| 2023 | $5,160 | $241,930 | $45,000 | $196,930 |
| 2022 | $5,274 | $207,920 | $40,000 | $167,920 |
| 2021 | $4,608 | $173,370 | $35,000 | $138,370 |
| 2020 | $4,738 | $168,050 | $35,000 | $133,050 |
| 2019 | $2,712 | $92,840 | $28,000 | $64,840 |
| 2018 | $1,707 | $61,940 | $0 | $0 |
| 2017 | $1,707 | $61,940 | $20,000 | $41,940 |
| 2015 | $1,286 | $46,550 | $17,000 | $29,550 |
| 2014 | $1,286 | $45,950 | $17,000 | $28,950 |
Source: Public Records
Map
Nearby Homes
- 601 Shawnee Trace
- 825 Apache Trace
- 405 SW 6th St
- 701 SW 5th St
- 806 Highland Dr
- 834 Short St
- 832 Beechcraft Ave
- 816 Earhart Ave
- 930 Shawnee Trace
- 218 Alice Dr
- 226 SW 4th St
- 1006 Ralph St
- 1101 Fort Worth St
- 1014 Ralph St
- 941 SW 4th St
- 1218 W Church St
- 1102 Ralph St
- 505 N Carrier Pkwy
- 1033 Tamara Ln
- 530 SE 2nd St
- 546 Cimarron Terrace
- 542 Cimarron Trace
- 802 Cherokee Trace
- 806 Cherokee Trace
- 538 Cimarron Trace
- 602 Cimarron Trace
- 810 Cherokee Trace
- 710 Cherokee Trace
- 814 Cherokee Trace
- 534 Cimarron Trace
- 513 Cimarron Trace
- 606 Cimarron Trace
- 509 Cimarron Trace
- 706 Cherokee Trace
- 818 Cherokee Trace
- 601 Cimarron Trace
- 530 Cimarron Trace
- 610 Cimarron Trace
- 822 Cherokee Trace
- 605 Cimarron Trace