Estimated Value: $177,000 - $264,000
--
Bed
--
Bath
1,664
Sq Ft
$129/Sq Ft
Est. Value
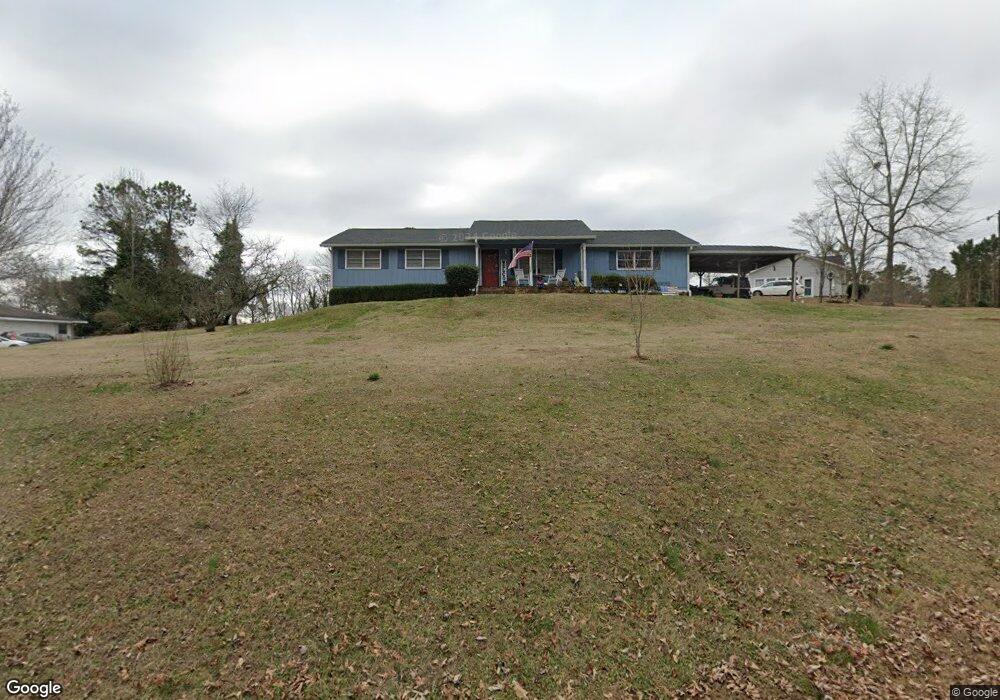
About This Home
This home is located at 546 Mountain View Rd SE, Rome, GA 30161 and is currently estimated at $214,811, approximately $129 per square foot. 546 Mountain View Rd SE is a home located in Floyd County with nearby schools including Pepperell Middle School, Pepperell High School, and Montessori School of Rome.
Ownership History
Date
Name
Owned For
Owner Type
Purchase Details
Closed on
Sep 21, 1987
Sold by
Kessler Russell and Mary Nell
Bought by
Mull Stevie L and Mull Darlene C
Current Estimated Value
Purchase Details
Closed on
Jun 9, 1983
Sold by
Lemming Larry
Bought by
Kessler Russell and Mary Nell
Purchase Details
Closed on
Feb 6, 1981
Sold by
Head Michael E and Head Pamela M
Bought by
Lemming Larry and Terry Charles E
Purchase Details
Closed on
Feb 7, 1977
Sold by
Ackerman Eugene D and Ackerman Patricia
Bought by
Head Michael E and Head Pamela M
Purchase Details
Closed on
May 15, 1975
Bought by
P and R
Purchase Details
Closed on
Dec 28, 1972
Sold by
Rod Dempsey Prop Inc
Bought by
Copeland Allen R
Purchase Details
Closed on
Oct 9, 1972
Sold by
Dempsey G Rodney
Bought by
Rod Dempsey Prop Inc
Purchase Details
Closed on
Apr 7, 1972
Sold by
Miller Miller E and Miller Arthur
Bought by
Dempsey G Rodney
Purchase Details
Closed on
Jan 1, 1901
Bought by
Miller Miller E and Miller Arthur
Create a Home Valuation Report for This Property
The Home Valuation Report is an in-depth analysis detailing your home's value as well as a comparison with similar homes in the area
Home Values in the Area
Average Home Value in this Area
Purchase History
| Date | Buyer | Sale Price | Title Company |
|---|---|---|---|
| Mull Stevie L | $41,000 | -- | |
| Kessler Russell | $39,500 | -- | |
| Lemming Larry | -- | -- | |
| Lemming Larry | $33,800 | -- | |
| Head Michael E | $32,200 | -- | |
| P | -- | -- | |
| P | $30,900 | -- | |
| Ackerman Eugene D | -- | -- | |
| Copeland Allen R | $7,000 | -- | |
| P | $28,000 | -- | |
| Rod Dempsey Prop Inc | -- | -- | |
| Dempsey G Rodney | -- | -- | |
| Miller Miller E | -- | -- |
Source: Public Records
Tax History Compared to Growth
Tax History
| Year | Tax Paid | Tax Assessment Tax Assessment Total Assessment is a certain percentage of the fair market value that is determined by local assessors to be the total taxable value of land and additions on the property. | Land | Improvement |
|---|---|---|---|---|
| 2024 | $815 | $67,533 | $13,523 | $54,010 |
| 2023 | $1,433 | $64,494 | $11,591 | $52,903 |
| 2022 | $1,165 | $47,471 | $9,659 | $37,812 |
| 2021 | $1,128 | $44,381 | $9,659 | $34,722 |
| 2020 | $1,077 | $41,148 | $7,727 | $33,421 |
| 2019 | $1,041 | $39,799 | $7,727 | $32,072 |
| 2018 | $1,017 | $38,378 | $7,727 | $30,651 |
| 2017 | $1,006 | $37,681 | $7,727 | $29,954 |
| 2016 | $1,010 | $37,238 | $7,720 | $29,518 |
| 2015 | $991 | $37,238 | $7,720 | $29,518 |
| 2014 | $991 | $37,238 | $7,720 | $29,518 |
Source: Public Records
Map
Nearby Homes
- 452 Mountain View Rd SE
- 145 Mountain View Rd SE
- 3018 Callier Springs Rd SE
- 3028 Callier Springs Rd SE
- 3038 Callier Springs Rd SE
- 93 Dodd Blvd SE
- 95 Dodd Blvd SE
- 74 Dodd Blvd SE
- 94 Dodd Blvd SE
- 94 A&B Dodd Blvd
- 263 Mountain View Rd SE
- 1 Joe Louis Blvd SE
- 7 Crestview Ln SE
- 4 Coach Trail SE
- 119 Chateau Dr SE
- 113 Chateau Dr SE
- 14 Gables Dr SE
- 11 Surrey Trail SE
- 46 Turnbull Dr SE
- 20 Covey Rise Dr SE
- 520 Mountain View Rd SE
- 568 Mountain View Rd SE
- 545 Mountain View Rd SE
- 545 Mountain View Rd SE
- 578 Mountain View Rd SE
- 519 Mountain View Rd SE
- 502-A B Mountain View Rd
- 567 Mountain View Rd SE
- 588 Mountain View Rd SE
- 588 Mountain View Rd SE
- 588 Mountain View Rd SE
- 588 Mountain View Rd SE
- 597 Mountain View Rd SE
- 480 Mountain View Rd SE
- 491 Mountain View Rd SE
- 598 Mountain View Rd SE
- 607 Mountain View Rd SE
- 2784 Callier Springs Rd SE
- 599 Mountain View Rd SE
- 460 Mountain View Rd SE