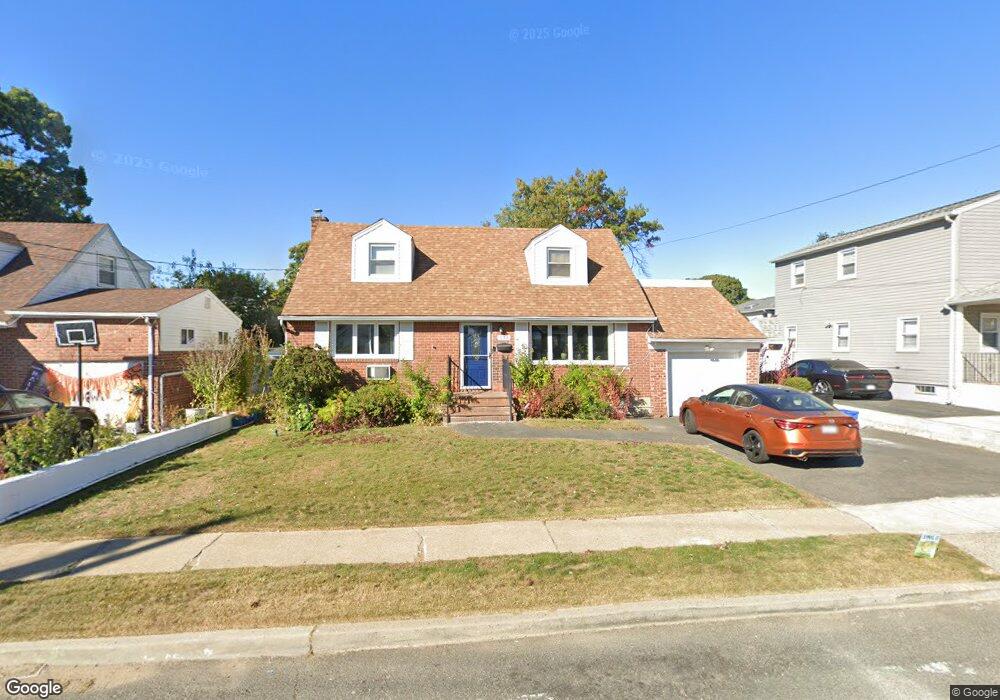
546 Oakley Ave Elmont, NY 11003
Estimated Value: $768,878 - $787,000
--
Bed
2
Baths
1,296
Sq Ft
$600/Sq Ft
Est. Value
About This Home
This home is located at 546 Oakley Ave, Elmont, NY 11003 and is currently estimated at $777,939, approximately $600 per square foot. 546 Oakley Ave is a home located in Nassau County with nearby schools including Cheder at the Ohel.
Ownership History
Date
Name
Owned For
Owner Type
Purchase Details
Closed on
Jul 21, 2008
Sold by
Monteleone Anthony
Bought by
Bissu Roopnarayan
Current Estimated Value
Purchase Details
Closed on
Nov 27, 2000
Purchase Details
Closed on
Nov 23, 1998
Create a Home Valuation Report for This Property
The Home Valuation Report is an in-depth analysis detailing your home's value as well as a comparison with similar homes in the area
Home Values in the Area
Average Home Value in this Area
Purchase History
| Date | Buyer | Sale Price | Title Company |
|---|---|---|---|
| Bissu Roopnarayan | $471,000 | -- | |
| -- | $280,000 | -- | |
| -- | -- | -- |
Source: Public Records
Tax History Compared to Growth
Tax History
| Year | Tax Paid | Tax Assessment Tax Assessment Total Assessment is a certain percentage of the fair market value that is determined by local assessors to be the total taxable value of land and additions on the property. | Land | Improvement |
|---|---|---|---|---|
| 2025 | $11,415 | $474 | $267 | $207 |
| 2024 | $4,058 | $474 | $267 | $207 |
| 2023 | $10,879 | $474 | $267 | $207 |
| 2022 | $10,879 | $474 | $267 | $207 |
| 2021 | $14,827 | $453 | $255 | $198 |
| 2020 | $11,565 | $784 | $578 | $206 |
| 2019 | $11,848 | $784 | $578 | $206 |
| 2018 | $11,188 | $784 | $0 | $0 |
| 2017 | $6,324 | $784 | $578 | $206 |
| 2016 | $10,170 | $784 | $578 | $206 |
| 2015 | $3,573 | $784 | $578 | $206 |
| 2014 | $3,573 | $784 | $578 | $206 |
| 2013 | $3,350 | $784 | $578 | $206 |
Source: Public Records
Map
Nearby Homes