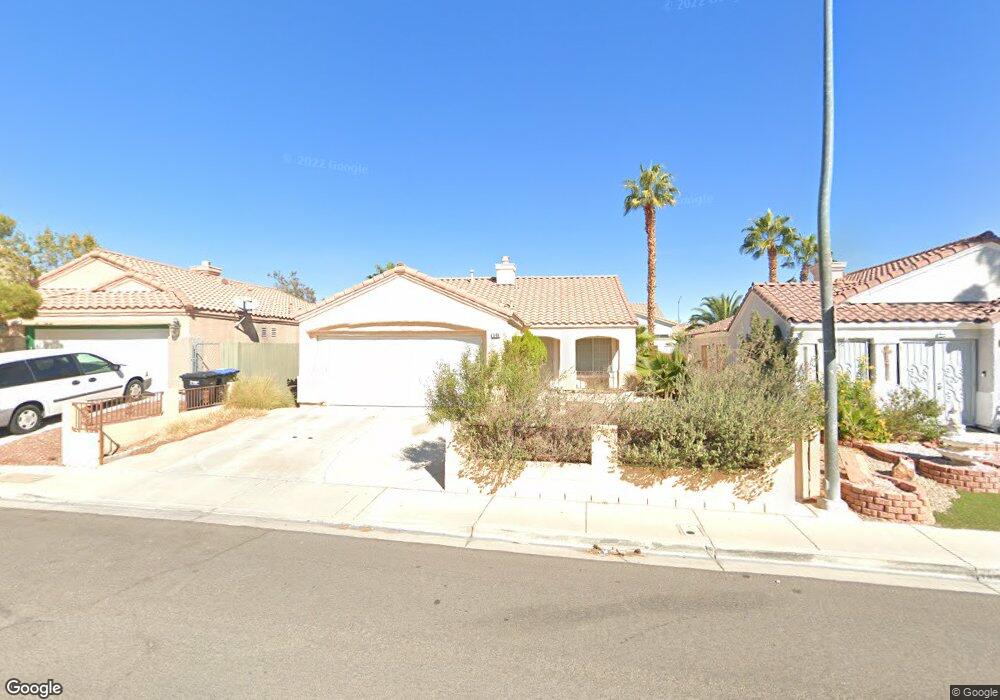
546 Rancho Del Norte Dr North Las Vegas, NV 89031
Craig Ranch NeighborhoodEstimated Value: $363,484 - $396,000
3
Beds
2
Baths
1,298
Sq Ft
$294/Sq Ft
Est. Value
About This Home
This home is located at 546 Rancho Del Norte Dr, North Las Vegas, NV 89031 and is currently estimated at $381,371, approximately $293 per square foot. 546 Rancho Del Norte Dr is a home located in Clark County with nearby schools including Raul P. Elizondo Elementary School, Clifford O. Findlay Middle School, and Mojave High School.
Ownership History
Date
Name
Owned For
Owner Type
Purchase Details
Closed on
Jul 10, 2015
Sold by
Thalheimer Frederick V and Thalheimer Susan M
Bought by
Sariba International Ltd
Current Estimated Value
Purchase Details
Closed on
May 27, 1998
Sold by
Hud
Bought by
Thalheimer Frederick and Thalheimer Susan M
Home Financials for this Owner
Home Financials are based on the most recent Mortgage that was taken out on this home.
Original Mortgage
$103,646
Interest Rate
7.13%
Mortgage Type
FHA
Purchase Details
Closed on
Oct 8, 1997
Sold by
Nevada Housing Division
Bought by
Hud
Purchase Details
Closed on
Sep 15, 1997
Sold by
Arroyo Oscar F and Baez Arroyo Rosa
Bought by
Nevada Housing Division
Purchase Details
Closed on
Aug 30, 1994
Sold by
Kaufman & Broad Of Nevada Inc
Bought by
Arroyo Oscar F and Baez Arroyo Rosa
Home Financials for this Owner
Home Financials are based on the most recent Mortgage that was taken out on this home.
Original Mortgage
$95,399
Interest Rate
8.65%
Mortgage Type
FHA
Create a Home Valuation Report for This Property
The Home Valuation Report is an in-depth analysis detailing your home's value as well as a comparison with similar homes in the area
Home Values in the Area
Average Home Value in this Area
Purchase History
| Date | Buyer | Sale Price | Title Company |
|---|---|---|---|
| Sariba International Ltd | $120,900 | Accommodation | |
| Thalheimer Frederick | -- | Stewart Title | |
| Hud | -- | Land Title | |
| Nevada Housing Division | $110,458 | Land Title | |
| Arroyo Oscar F | $97,000 | Nevada Title Company |
Source: Public Records
Mortgage History
| Date | Status | Borrower | Loan Amount |
|---|---|---|---|
| Previous Owner | Thalheimer Frederick | $103,646 | |
| Previous Owner | Arroyo Oscar F | $95,399 |
Source: Public Records
Tax History Compared to Growth
Tax History
| Year | Tax Paid | Tax Assessment Tax Assessment Total Assessment is a certain percentage of the fair market value that is determined by local assessors to be the total taxable value of land and additions on the property. | Land | Improvement |
|---|---|---|---|---|
| 2025 | $1,398 | $83,387 | $30,100 | $53,287 |
| 2024 | $1,295 | $83,387 | $30,100 | $53,287 |
| 2023 | $1,295 | $78,656 | $28,000 | $50,656 |
| 2022 | $1,199 | $68,656 | $22,050 | $46,606 |
| 2021 | $1,111 | $65,451 | $21,000 | $44,451 |
| 2020 | $1,028 | $64,089 | $19,950 | $44,139 |
| 2019 | $964 | $58,956 | $15,400 | $43,556 |
| 2018 | $920 | $54,510 | $12,250 | $42,260 |
| 2017 | $1,706 | $50,844 | $10,850 | $39,994 |
| 2016 | $862 | $45,009 | $8,400 | $36,609 |
| 2015 | $859 | $34,910 | $5,950 | $28,960 |
| 2014 | $834 | $25,910 | $4,900 | $21,010 |
Source: Public Records
Map
Nearby Homes
- 4915 Via Luis Ct
- 5038 Vista Del Rio Way
- 524 Rancho Del Sol Way
- 3601 Allen Creek Ct
- 4822 Con Carne Ct
- 908 Cypress Gold Ct
- 4784 Wild Draw Dr
- 5243 Edna Crane Ave
- 5243 Willowdale Ct
- 4762 Wild Draw Dr
- 5136 Stonecrop St
- 4744 Big Draw Dr
- 1132 Turnstone Ct
- 5045 Bayberry Crest St
- 13 Deseo Ct
- 921 Evening Fawn Dr
- 1038 Solemn Cactus Ave
- 621 Carlos Julio Ave
- 4752 Cactus Sun Ln
- 1213 Stonesthrow Cir
- 542 Rancho Del Norte Dr
- 550 Rancho Del Norte Dr
- 538 Rancho Del Norte Dr
- 537 Casa Del Norte Dr
- 541 Casa Del Norte Dr
- 533 Casa Del Norte Dr
- 534 Rancho Del Norte Dr
- 4937 Via Luis Ct
- 545 Casa Del Norte Dr
- 604 Rancho Del Norte Dr
- 529 Casa Del Norte Dr
- 603 Rancho Del Norte Dr
- 530 Rancho Del Norte Dr
- 4933 Via Luis Ct
- 549 Casa Del Norte Dr
- 608 Rancho Del Norte Dr
- 607 Rancho Del Norte Dr
- 525 Casa Del Norte Dr
- 526 Rancho Del Norte Dr