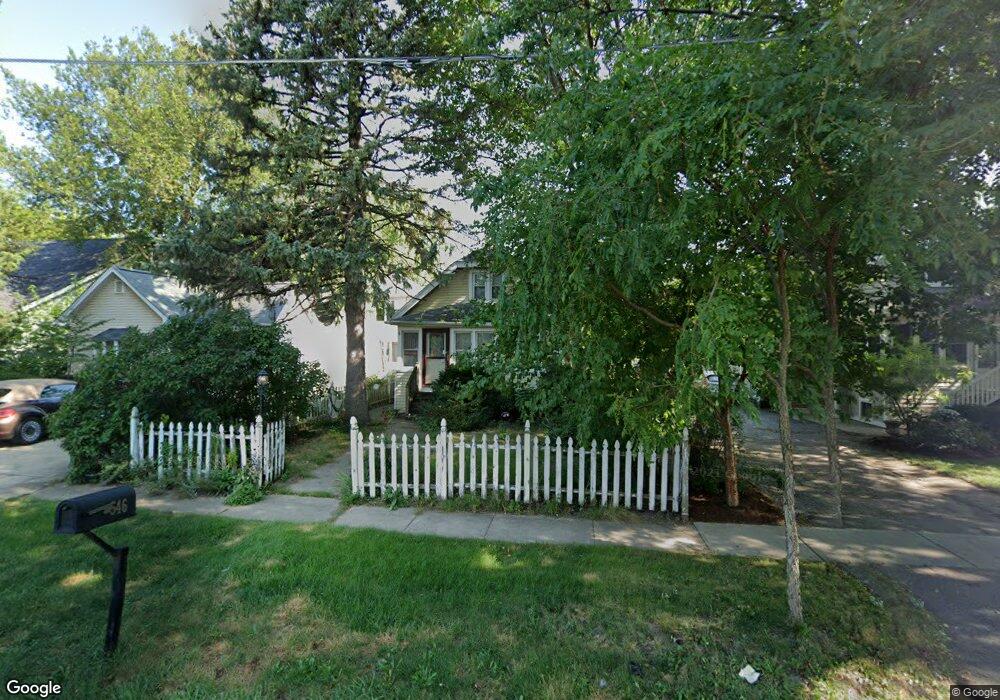
546 Saint Charles Rd Glen Ellyn, IL 60137
Estimated Value: $213,089 - $333,000
3
Beds
1
Bath
858
Sq Ft
$312/Sq Ft
Est. Value
About This Home
This home is located at 546 Saint Charles Rd, Glen Ellyn, IL 60137 and is currently estimated at $267,522, approximately $311 per square foot. 546 Saint Charles Rd is a home located in DuPage County with nearby schools including Forest Glen Elementary School, Hadley Junior High School, and Glenbard West High School.
Ownership History
Date
Name
Owned For
Owner Type
Purchase Details
Closed on
Nov 22, 2002
Sold by
Cistaro James M and Cistaro Jennifer
Bought by
Bellinder Candace R
Current Estimated Value
Home Financials for this Owner
Home Financials are based on the most recent Mortgage that was taken out on this home.
Original Mortgage
$60,000
Interest Rate
4.75%
Mortgage Type
Purchase Money Mortgage
Purchase Details
Closed on
Sep 20, 1999
Sold by
Sherwood Steven F and Sherwood Sandra E
Bought by
Cistaro James M and Cistaro Nicholas Jennifer
Home Financials for this Owner
Home Financials are based on the most recent Mortgage that was taken out on this home.
Original Mortgage
$118,712
Interest Rate
7.83%
Mortgage Type
FHA
Create a Home Valuation Report for This Property
The Home Valuation Report is an in-depth analysis detailing your home's value as well as a comparison with similar homes in the area
Home Values in the Area
Average Home Value in this Area
Purchase History
| Date | Buyer | Sale Price | Title Company |
|---|---|---|---|
| Bellinder Candace R | $182,000 | -- | |
| Cistaro James M | $120,000 | -- |
Source: Public Records
Mortgage History
| Date | Status | Borrower | Loan Amount |
|---|---|---|---|
| Previous Owner | Bellinder Candace R | $60,000 | |
| Previous Owner | Cistaro James M | $118,712 |
Source: Public Records
Tax History Compared to Growth
Tax History
| Year | Tax Paid | Tax Assessment Tax Assessment Total Assessment is a certain percentage of the fair market value that is determined by local assessors to be the total taxable value of land and additions on the property. | Land | Improvement |
|---|---|---|---|---|
| 2024 | $2,789 | $55,037 | $6,388 | $48,649 |
| 2023 | $2,580 | $50,660 | $5,880 | $44,780 |
| 2022 | $2,761 | $47,870 | $5,550 | $42,320 |
| 2021 | $2,639 | $46,740 | $5,420 | $41,320 |
| 2020 | $2,580 | $46,300 | $5,370 | $40,930 |
| 2019 | $2,504 | $45,080 | $5,230 | $39,850 |
| 2018 | $2,568 | $40,680 | $4,930 | $35,750 |
| 2017 | $2,517 | $39,180 | $4,750 | $34,430 |
| 2016 | $2,536 | $37,610 | $4,560 | $33,050 |
| 2015 | $2,512 | $35,880 | $4,350 | $31,530 |
| 2014 | $3,272 | $43,510 | $2,490 | $41,020 |
| 2013 | $3,186 | $43,640 | $2,500 | $41,140 |
Source: Public Records
Map
Nearby Homes
- 471 Stagecoach Run
- 449 Geneva Rd
- 721 Lenox Rd
- 731 Western Ave
- 1N450 Highland Ave
- 333 Elm St
- 295 Elm St
- 305 Maple St
- 1002 Spruce St Unit 1B
- 369 Hawthorne Blvd
- 277 Shorewood Dr Unit 2A
- 567 Deerpath Rd
- 416 Anthony St
- 267 Shorewood Dr Unit GB
- 1N713 Evergreen Ave
- 534 Western Ave
- 843 Crescent Blvd
- 462 Pennsylvania Ave Unit 4S
- 266 Shorewood Dr Unit 1
- 1160 Cedar St Unit 3A
- 548 Saint Charles Rd
- 538 Saint Charles Rd
- 22W530 St Charles Rd
- 550 Saint Charles Rd
- 530 Saint Charles Rd
- 1N120 Stacy Ct
- 554 Saint Charles Rd
- 534 Saint Charles Rd
- 22W515 Emerson Ave
- 22W523 Emerson Ave
- 545 Emerson Ave
- 932 Stacy Ct
- 532 Saint Charles Rd
- 22W533 Emerson Ave
- 1N144 Stacy Ct
- 22W543 Emerson Ave
- 22W549 Emerson Ave
- 540 Saint Charles Rd
- 1N162 Stacy Ct
- 525 Emerson Ave