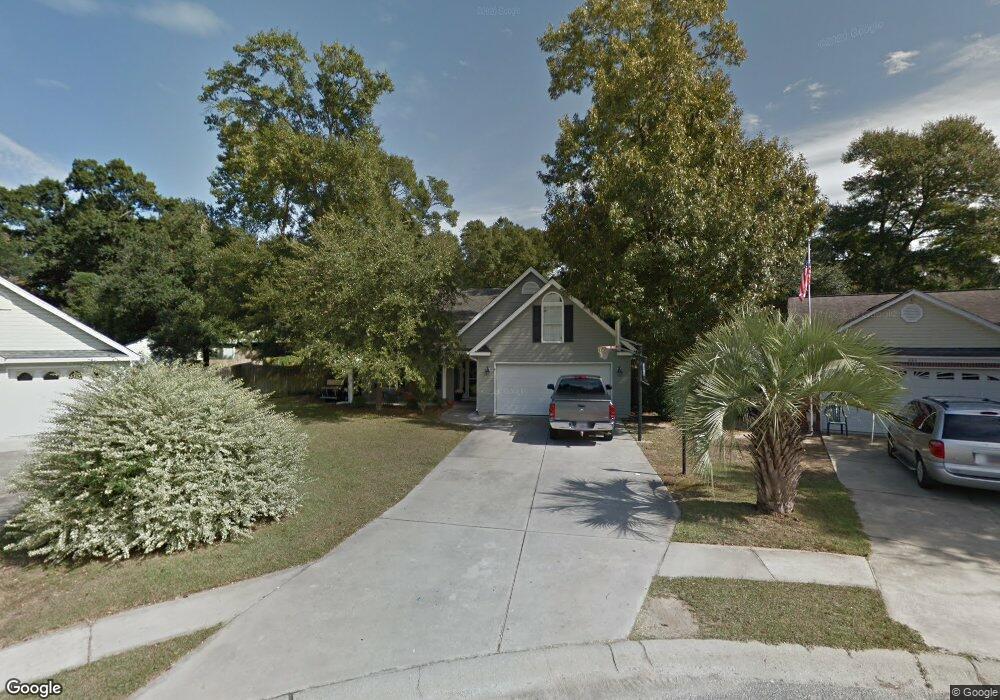
546 Waverly Loop Murrells Inlet, SC 29576
Estimated Value: $388,000 - $552,000
3
Beds
3
Baths
2,028
Sq Ft
$245/Sq Ft
Est. Value
About This Home
This home is located at 546 Waverly Loop, Murrells Inlet, SC 29576 and is currently estimated at $496,157, approximately $244 per square foot. 546 Waverly Loop is a home located in Horry County with nearby schools including Seaside Elementary, St. James Middle School, and St. James Intermediate.
Ownership History
Date
Name
Owned For
Owner Type
Purchase Details
Closed on
Apr 19, 2007
Sold by
Taylor Irvin Joanne Renee and Taylor Irvin Scott
Bought by
Walker Dennis Gilbert
Current Estimated Value
Purchase Details
Closed on
Feb 18, 2005
Sold by
Devco Properties Llc
Bought by
Taylor Irvin Joanne Renee and Taylor Irvin Scott
Home Financials for this Owner
Home Financials are based on the most recent Mortgage that was taken out on this home.
Original Mortgage
$196,650
Interest Rate
5.12%
Mortgage Type
Construction
Purchase Details
Closed on
May 10, 2000
Sold by
Mckinnon Murray S and Mckinnon Ann W
Bought by
Riley Robert T
Purchase Details
Closed on
Apr 23, 1999
Sold by
Wave Development Llc
Bought by
Mckinnon Murray S and Mckinnon Ann W
Create a Home Valuation Report for This Property
The Home Valuation Report is an in-depth analysis detailing your home's value as well as a comparison with similar homes in the area
Home Values in the Area
Average Home Value in this Area
Purchase History
| Date | Buyer | Sale Price | Title Company |
|---|---|---|---|
| Walker Dennis Gilbert | -- | None Available | |
| Taylor Irvin Joanne Renee | $67,000 | -- | |
| Riley Robert T | $45,000 | -- | |
| Mckinnon Murray S | $37,000 | -- |
Source: Public Records
Mortgage History
| Date | Status | Borrower | Loan Amount |
|---|---|---|---|
| Previous Owner | Taylor Irvin Joanne Renee | $196,650 |
Source: Public Records
Tax History Compared to Growth
Tax History
| Year | Tax Paid | Tax Assessment Tax Assessment Total Assessment is a certain percentage of the fair market value that is determined by local assessors to be the total taxable value of land and additions on the property. | Land | Improvement |
|---|---|---|---|---|
| 2024 | $1,217 | $18,108 | $8,560 | $9,548 |
| 2023 | $1,217 | $9,981 | $3,250 | $6,731 |
| 2021 | $947 | $13,380 | $5,568 | $7,812 |
| 2020 | $847 | $13,380 | $5,568 | $7,812 |
| 2019 | $847 | $13,380 | $5,568 | $7,812 |
| 2018 | $760 | $9,268 | $3,080 | $6,188 |
| 2017 | $745 | $9,268 | $3,080 | $6,188 |
| 2016 | -- | $9,268 | $3,080 | $6,188 |
| 2015 | $745 | $9,268 | $3,080 | $6,188 |
| 2014 | $647 | $9,268 | $3,080 | $6,188 |
Source: Public Records
Map
Nearby Homes
- 855 Riven Oak Dr Unit Mt. Gilead-Horry Cou
- 425 E Surfwind Dr
- 429 E Surfwind Dr Unit Lot 47
- 592 Trizzie Trail
- 596 Trizzie Trail
- 1 Seaway Ln
- 571 Fernwood Rd
- 598 Rum Gully Rd
- 40 Shamrock Cir
- 801 Rebecca Ln Unit 7C
- 801 Rebecca Ln Unit 7A
- 801 Rebecca Ln Unit 7B
- 801 Rebecca Ln Unit 7D
- 34 Shamrock Cir
- 422 Vereen Rd
- 2 Keel Ln
- 17 Offshore Dr
- 181 Offshore Dr
- 517 Porter Dr
- 510 Rum Gully Rd
- 544 Waverly Loop
- 548 Waverly Loop
- 395 Stanley Dr
- 837 Flicker Place
- 542 Waverly Loop
- 399 Stanley Dr
- 838 Flicker Place
- 829 Flicker Place
- 375 Stanley Dr
- 550 Waverly Loop
- 547 Waverly Loop
- 540 Waverly Loop
- 507 Waverly Loop
- 505 Waverly Loop
- 551 Waverly Loop
- 830 Flicker Place
- 538 Waverly Loop
- 394 Stanley Dr
- 531 Waverly Loop Unit Stanley Cove
- 531 Waverly Loop