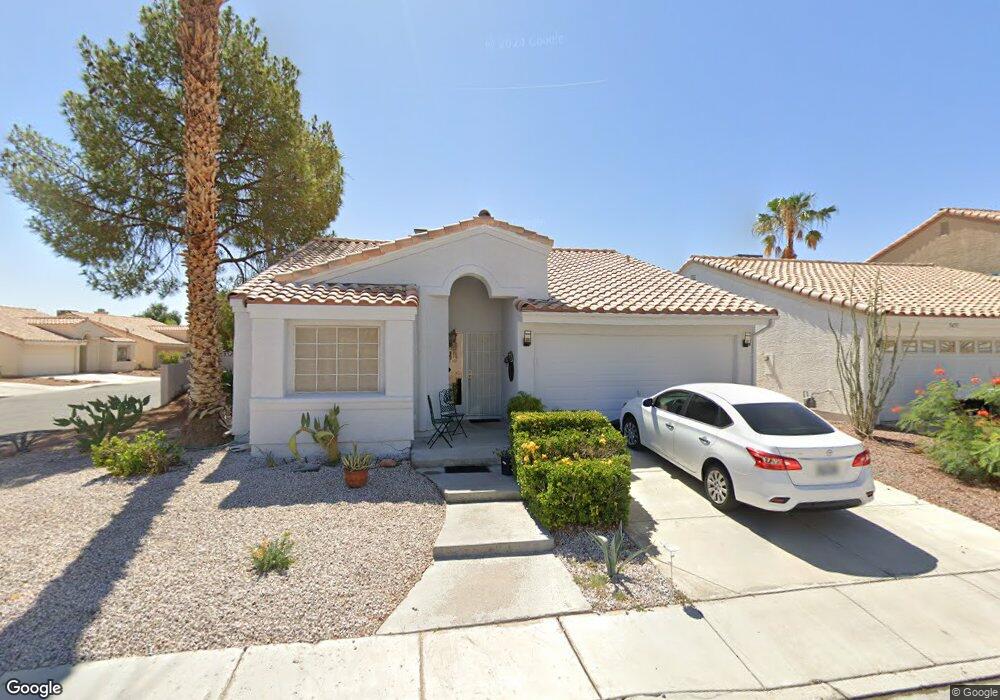
5461 Australian Ave Unit 1 Las Vegas, NV 89142
Estimated Value: $348,000 - $369,000
2
Beds
2
Baths
1,434
Sq Ft
$251/Sq Ft
Est. Value
About This Home
This home is located at 5461 Australian Ave Unit 1, Las Vegas, NV 89142 and is currently estimated at $360,102, approximately $251 per square foot. 5461 Australian Ave Unit 1 is a home located in Clark County with nearby schools including Jenkins Earl N. Elementary School, Kathleen & Tim Harney Middle School, and Chaparral High School.
Ownership History
Date
Name
Owned For
Owner Type
Purchase Details
Closed on
May 6, 2003
Sold by
Fry William E and Fry Leah R
Bought by
Hess Bruce L and Hess Carolyn K
Current Estimated Value
Home Financials for this Owner
Home Financials are based on the most recent Mortgage that was taken out on this home.
Original Mortgage
$119,888
Outstanding Balance
$52,295
Interest Rate
5.84%
Estimated Equity
$307,807
Purchase Details
Closed on
Jul 19, 2001
Sold by
Fry William E and Fry Leah R
Bought by
Fry William E and Fry Leah R
Purchase Details
Closed on
Oct 13, 1998
Sold by
Toney Geoffrey B and Toney Maria L
Bought by
Fry William E and Fry Leah R
Home Financials for this Owner
Home Financials are based on the most recent Mortgage that was taken out on this home.
Original Mortgage
$84,000
Interest Rate
6.79%
Purchase Details
Closed on
Oct 12, 1995
Sold by
Priaulx Donald G and Priaulx Aeran P
Bought by
Fry William E and Fry Leah R
Create a Home Valuation Report for This Property
The Home Valuation Report is an in-depth analysis detailing your home's value as well as a comparison with similar homes in the area
Home Values in the Area
Average Home Value in this Area
Purchase History
| Date | Buyer | Sale Price | Title Company |
|---|---|---|---|
| Hess Bruce L | $135,000 | Old Republic Title Company | |
| Fry William E | $120,000 | -- | |
| Fry William E | -- | First American Title Co | |
| Fry William E | -- | First American Title Co |
Source: Public Records
Mortgage History
| Date | Status | Borrower | Loan Amount |
|---|---|---|---|
| Open | Hess Bruce L | $119,888 | |
| Previous Owner | Fry William E | $84,000 |
Source: Public Records
Tax History Compared to Growth
Tax History
| Year | Tax Paid | Tax Assessment Tax Assessment Total Assessment is a certain percentage of the fair market value that is determined by local assessors to be the total taxable value of land and additions on the property. | Land | Improvement |
|---|---|---|---|---|
| 2025 | $1,195 | $59,603 | $22,750 | $36,853 |
| 2024 | $1,107 | $59,603 | $22,750 | $36,853 |
| 2023 | $776 | $63,665 | $28,000 | $35,665 |
| 2022 | $1,025 | $58,720 | $25,900 | $32,820 |
| 2021 | $949 | $52,905 | $21,350 | $31,555 |
| 2020 | $879 | $50,513 | $18,900 | $31,613 |
| 2019 | $868 | $47,927 | $16,450 | $31,477 |
| 2018 | $828 | $42,660 | $12,250 | $30,410 |
| 2017 | $1,318 | $44,951 | $14,000 | $30,951 |
| 2016 | $776 | $42,401 | $10,850 | $31,551 |
| 2015 | $774 | $29,913 | $7,000 | $22,913 |
| 2014 | $751 | $26,438 | $5,250 | $21,188 |
Source: Public Records
Map
Nearby Homes
- 5402 Tahoe Dr
- 5495 Everglade St
- 2883 Mammoth Ct
- 5556 Everglade St
- 2819 Beaconfalls Way
- 5545 Everglade St
- 5330 Walton Heath Ave
- 2884 Green Tree Ave
- 5512 Aldama Rd
- 2890 Lassen Ct
- 2873 Humboldt Ct
- 5466 Petaca Rd
- 5584 Aldama Rd
- 2966 Juniper Hills Blvd Unit 201
- 2966 Juniper Hills Blvd Unit 204
- 2966 Juniper Hills Blvd Unit 102
- 2872 Humboldt Ct
- 2916 Gavilan Ln
- 5563 Petaca Rd
- 2508 Alfa Cir
- 5455 Australian Ave Unit 1
- 5483 Walton Heath Ave
- 5449 Australian Ave
- 5489 Walton Heath Ave Unit 1
- 5437 Walton Heath Ave
- 5452 Walton Heath Ave
- 5446 Walton Heath Ave Unit 1
- 5495 Walton Heath Ave
- 5443 Australian Ave
- 5464 Walton Heath Ave
- 5450 Australian Ave
- 5442 Walton Heath Ave
- 5431 Walton Heath Ave
- 5470 Walton Heath Ave
- 5444 Australian Ave
- 5436 Walton Heath Ave Unit 1
- 5501 Walton Heath Ave
- 5437 Australian Ave
- 5482 Walton Heath Ave
- 5425 Walton Heath Ave