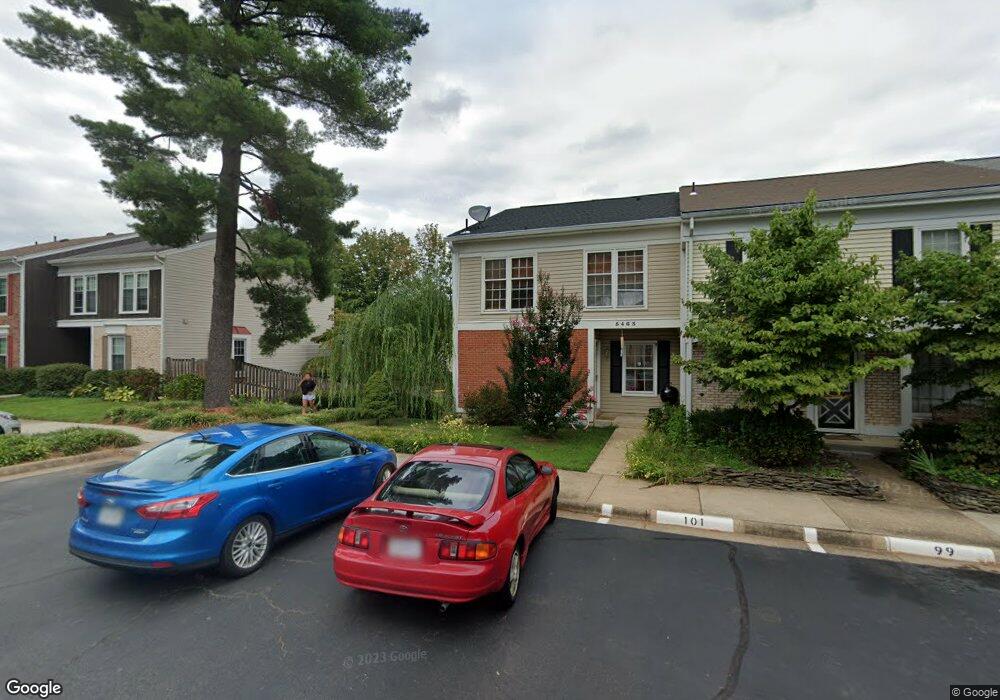
5463 Safe Harbor Ct Fairfax, VA 22032
Estimated Value: $622,000 - $648,000
3
Beds
4
Baths
2,039
Sq Ft
$311/Sq Ft
Est. Value
About This Home
This home is located at 5463 Safe Harbor Ct, Fairfax, VA 22032 and is currently estimated at $633,631, approximately $310 per square foot. 5463 Safe Harbor Ct is a home located in Fairfax County with nearby schools including Laurel Ridge Elementary School, James W Robinson, Jr. Secondary School, and Fairfax Baptist Temple Academy.
Ownership History
Date
Name
Owned For
Owner Type
Purchase Details
Closed on
Aug 31, 2015
Sold by
Marchese Thomas J
Bought by
Oulebsir Linda
Current Estimated Value
Home Financials for this Owner
Home Financials are based on the most recent Mortgage that was taken out on this home.
Original Mortgage
$390,910
Outstanding Balance
$308,908
Interest Rate
4.09%
Mortgage Type
New Conventional
Estimated Equity
$324,723
Purchase Details
Closed on
Apr 15, 2009
Sold by
Nationstar Mtg L L C
Bought by
Marchese Thomas J
Home Financials for this Owner
Home Financials are based on the most recent Mortgage that was taken out on this home.
Original Mortgage
$249,399
Interest Rate
4.86%
Mortgage Type
FHA
Purchase Details
Closed on
Aug 28, 2008
Sold by
Sub Glasser and Sub Glasser Plc
Bought by
Nationstar Mortgage Llc
Create a Home Valuation Report for This Property
The Home Valuation Report is an in-depth analysis detailing your home's value as well as a comparison with similar homes in the area
Home Values in the Area
Average Home Value in this Area
Purchase History
| Date | Buyer | Sale Price | Title Company |
|---|---|---|---|
| Oulebsir Linda | $403,000 | Ekko Title | |
| Marchese Thomas J | $254,000 | -- | |
| Nationstar Mortgage Llc | $314,500 | -- |
Source: Public Records
Mortgage History
| Date | Status | Borrower | Loan Amount |
|---|---|---|---|
| Open | Oulebsir Linda | $390,910 | |
| Previous Owner | Marchese Thomas J | $249,399 |
Source: Public Records
Tax History Compared to Growth
Tax History
| Year | Tax Paid | Tax Assessment Tax Assessment Total Assessment is a certain percentage of the fair market value that is determined by local assessors to be the total taxable value of land and additions on the property. | Land | Improvement |
|---|---|---|---|---|
| 2025 | $5,951 | $557,820 | $165,000 | $392,820 |
| 2024 | $5,951 | $513,640 | $145,000 | $368,640 |
| 2023 | $5,838 | $517,320 | $145,000 | $372,320 |
| 2022 | $5,750 | $502,840 | $140,000 | $362,840 |
| 2021 | $5,295 | $451,180 | $125,000 | $326,180 |
| 2020 | $4,997 | $422,220 | $110,000 | $312,220 |
| 2019 | $4,413 | $372,870 | $105,000 | $267,870 |
| 2018 | $4,096 | $356,210 | $105,000 | $251,210 |
| 2017 | $3,879 | $334,150 | $97,000 | $237,150 |
| 2016 | $3,991 | $344,520 | $105,000 | $239,520 |
| 2015 | $3,679 | $329,630 | $105,000 | $224,630 |
| 2014 | $3,523 | $316,410 | $94,000 | $222,410 |
Source: Public Records
Map
Nearby Homes
- 5431 Crows Nest Ct
- 9954 Wood Wren Ct
- 10278 Colony Park Dr
- 9909 Lakepointe Dr
- 5370 Gainsborough Dr
- 10434 Calumet Grove Dr
- 10412 Pearl St
- 10402 Hollyoak Place
- 5808 Wood Laurel Ct
- 5806 Cove Landing Rd Unit 304
- 5819 Cove Landing Rd Unit 303
- 5602 Summer Oak Way
- 5838 High Bluff Ct
- 5902 Cove Landing Rd Unit 202
- 5833 Cove Landing Rd Unit 304
- 5907 Wood Sorrels Ct
- 5940 Cove Landing Rd Unit 304
- 5711 Crownleigh Ct
- 5922 New England Woods Dr
- 5714 Mason Bluff Dr
- 5461 Safe Harbor Ct
- 5459 Safe Harbor Ct
- 5465 Safe Harbor Ct
- 5457 Safe Harbor Ct
- 5467 Safe Harbor Ct
- 5421 Crows Nest Ct
- 5423 Crows Nest Ct
- 5469 Safe Harbor Ct
- 5425 Crows Nest Ct
- 5444 Safe Harbor Ct
- 5453 Safe Harbor Ct
- 5427 Crows Nest Ct
- 5471 Safe Harbor Ct
- 5482 Safe Harbor Ct
- 5442 Safe Harbor Ct
- 5451 Safe Harbor Ct
- 5473 Safe Harbor Ct
- 5449 Safe Harbor Ct
- 5440 Safe Harbor Ct
- 5484 Safe Harbor Ct