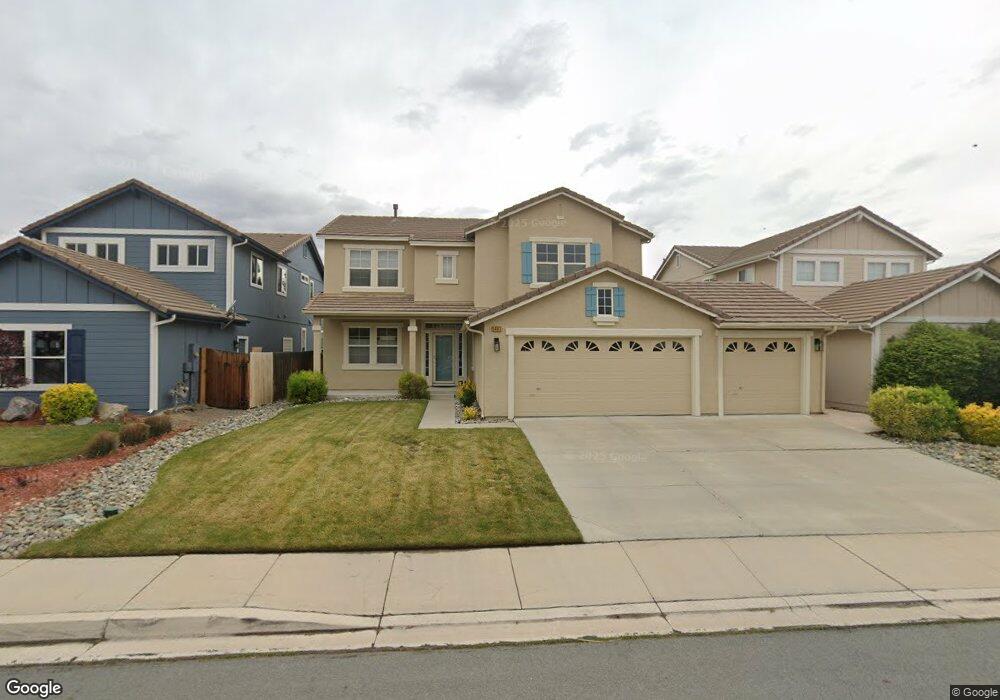
5463 Spandrell Ln Unit 2C Sparks, NV 89436
Los Altos Parkway NeighborhoodEstimated Value: $600,330 - $628,000
4
Beds
3
Baths
2,445
Sq Ft
$254/Sq Ft
Est. Value
About This Home
This home is located at 5463 Spandrell Ln Unit 2C, Sparks, NV 89436 and is currently estimated at $619,833, approximately $253 per square foot. 5463 Spandrell Ln Unit 2C is a home located in Washoe County with nearby schools including Bud Beasley Elementary School, Lou Mendive Middle School, and Edward C Reed High School.
Ownership History
Date
Name
Owned For
Owner Type
Purchase Details
Closed on
Jun 11, 2013
Sold by
Huynh Howard
Bought by
Huynh Howard and Huynh Tara
Current Estimated Value
Purchase Details
Closed on
Apr 30, 2013
Sold by
Huynh Howard
Bought by
Huynh Howard and Huynh Tara
Purchase Details
Closed on
Oct 24, 2007
Sold by
Huynh Howard
Bought by
Huynh Howard and Huynh Phong Ky
Purchase Details
Closed on
May 7, 2003
Sold by
Pinnacles At Vista Ridge Llc
Bought by
Huynh Howard
Home Financials for this Owner
Home Financials are based on the most recent Mortgage that was taken out on this home.
Original Mortgage
$35,000
Interest Rate
5.84%
Create a Home Valuation Report for This Property
The Home Valuation Report is an in-depth analysis detailing your home's value as well as a comparison with similar homes in the area
Home Values in the Area
Average Home Value in this Area
Purchase History
| Date | Buyer | Sale Price | Title Company |
|---|---|---|---|
| Huynh Howard | -- | None Available | |
| Huynh Howard | -- | None Available | |
| Huynh Howard | -- | None Available | |
| Huynh Howard | -- | None Available | |
| Huynh Howard | -- | None Available | |
| Huynh Howard | $241,610 | First American Title |
Source: Public Records
Mortgage History
| Date | Status | Borrower | Loan Amount |
|---|---|---|---|
| Previous Owner | Huynh Howard | $35,000 |
Source: Public Records
Tax History Compared to Growth
Tax History
| Year | Tax Paid | Tax Assessment Tax Assessment Total Assessment is a certain percentage of the fair market value that is determined by local assessors to be the total taxable value of land and additions on the property. | Land | Improvement |
|---|---|---|---|---|
| 2026 | -- | $136,476 | $40,285 | $96,191 |
| 2025 | $3,211 | $138,022 | $40,285 | $97,737 |
| 2024 | $3,211 | $132,410 | $33,880 | $98,530 |
| 2023 | $3,118 | $131,668 | $38,430 | $93,238 |
| 2022 | $3,029 | $109,247 | $31,745 | $77,502 |
| 2021 | $2,939 | $104,438 | $27,405 | $77,033 |
| 2020 | $2,852 | $103,189 | $26,040 | $77,149 |
| 2019 | $2,716 | $99,513 | $25,655 | $73,858 |
| 2018 | $2,637 | $90,586 | $18,375 | $72,211 |
| 2017 | $2,561 | $89,604 | $17,325 | $72,279 |
| 2016 | $2,496 | $88,737 | $16,275 | $72,462 |
| 2015 | $627 | $86,423 | $14,455 | $71,968 |
| 2014 | $2,381 | $79,583 | $12,005 | $67,578 |
| 2013 | -- | $63,795 | $9,310 | $54,485 |
Source: Public Records
Map
Nearby Homes
- 5688 Spandrell Cir
- 5227 Vista Heights Dr
- The Heights, Plan 3X at The Heights
- The Heights, Plan 2 at The Heights
- The Heights, Plan 1X at The Heights
- The Heights, Plan 1 at The Heights
- The Heights, Plan 4 at The Heights
- The Heights, Plan 3 at The Heights
- 5148 Komatite Ct
- 5448 Fossilstone Dr
- 5410 Cactus Quartz Ct
- 5465 Spirit Ct
- 1716 Canyon Terrace Dr
- 2353 Old Waverly Dr
- 3028 Earthstone Dr
- 3040 Earthstone Dr
- 3052 Earthstone Dr
- 2738 Kettle Ct
- 4797 High Pass Dr
- 2910 Albazano Ct
- 5459 Spandrell Ln Unit 2C
- 5467 Spandrell Ln Unit 2C
- 5471 Spandrell Ln
- 5455 Spandrell Ln
- 2343 Abacus Ct
- 5477 Spandrell Ln
- 5448 Spanish Moss Ct
- 5453 Spandrell Ln
- 5464 Spandrell Ln
- 5460 Spandrell Ln
- 5470 Spandrell Ln
- 2337 Abacus Ct Unit 2C
- 2344 Abacus Ct Unit 2C
- 5451 Spanish Moss Ct Unit 2C
- 5454 Spandrell Ln Unit 2C
- 5474 Spandrell Ln
- 5481 Spandrell Ln Unit 2C
- 5444 Spanish Moss Ct
- 5480 Spandrell Ln
- 2331 Abacus Ct Unit 2C