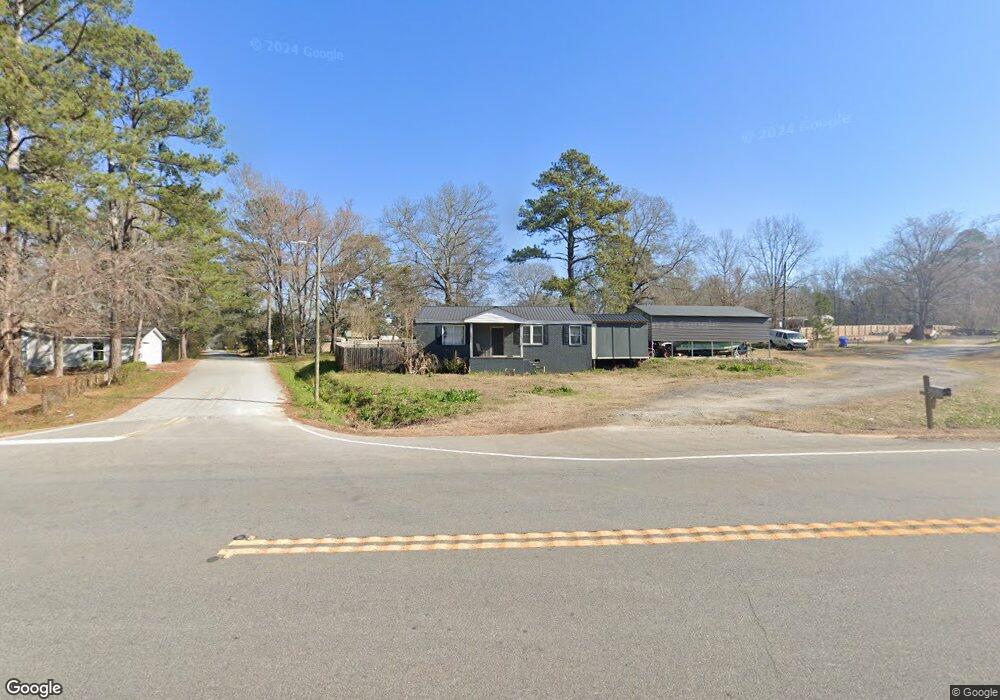
5463 Washington Rd Appling, GA 30802
Estimated Value: $118,000 - $239,000
Studio
--
Bath
1,206
Sq Ft
$134/Sq Ft
Est. Value
About This Home
This home is located at 5463 Washington Rd, Appling, GA 30802 and is currently estimated at $161,566, approximately $133 per square foot. 5463 Washington Rd is a home with nearby schools including Greenbrier Elementary School, Greenbrier Middle School, and Greenbrier High School.
Ownership History
Date
Name
Owned For
Owner Type
Purchase Details
Closed on
Jan 26, 2007
Sold by
Shaffer John R
Bought by
Fernandes Mark
Current Estimated Value
Home Financials for this Owner
Home Financials are based on the most recent Mortgage that was taken out on this home.
Original Mortgage
$66,000
Outstanding Balance
$39,288
Interest Rate
6.14%
Mortgage Type
New Conventional
Estimated Equity
$122,278
Purchase Details
Closed on
May 26, 2005
Sold by
Evans Norfee
Bought by
Shaffer John R
Purchase Details
Closed on
May 16, 2005
Sold by
Alesia Evans-Burrus Judith
Bought by
Shaffer John R
Purchase Details
Closed on
May 13, 2005
Sold by
Sedacy Sharon T
Bought by
Shaffer John R
Purchase Details
Closed on
May 11, 2005
Sold by
Evans Norfee
Bought by
Shaffer John R
Purchase Details
Closed on
May 3, 2005
Sold by
Evans Edward
Bought by
Shaffer John R
Purchase Details
Closed on
Apr 27, 2005
Sold by
Ann Evans-Hicks Patsy
Bought by
Shaffer John R
Create a Home Valuation Report for This Property
The Home Valuation Report is an in-depth analysis detailing your home's value as well as a comparison with similar homes in the area
Purchase History
| Date | Buyer | Sale Price | Title Company |
|---|---|---|---|
| Fernandes Mark | $66,000 | -- | |
| Shaffer John R | $37,000 | -- | |
| Shaffer John R | -- | -- | |
| Shaffer John R | -- | -- | |
| Shaffer John R | -- | -- | |
| Shaffer John R | -- | -- | |
| Shaffer John R | -- | -- |
Source: Public Records
Mortgage History
| Date | Status | Borrower | Loan Amount |
|---|---|---|---|
| Open | Fernandes Mark | $66,000 |
Source: Public Records
Tax History
| Year | Tax Paid | Tax Assessment Tax Assessment Total Assessment is a certain percentage of the fair market value that is determined by local assessors to be the total taxable value of land and additions on the property. | Land | Improvement |
|---|---|---|---|---|
| 2025 | $1,036 | $40,952 | $12,809 | $28,143 |
| 2024 | $925 | $34,629 | $9,972 | $24,657 |
| 2023 | $925 | $30,886 | $7,234 | $23,652 |
| 2022 | $616 | $21,397 | $6,451 | $14,946 |
| 2021 | $617 | $20,484 | $6,451 | $14,033 |
| 2020 | $616 | $20,028 | $6,451 | $13,577 |
| 2019 | $603 | $19,573 | $6,451 | $13,122 |
| 2018 | $599 | $19,375 | $6,255 | $13,120 |
| 2017 | $600 | $19,337 | $6,255 | $13,082 |
| 2016 | $545 | $18,001 | $5,216 | $12,785 |
| 2015 | $536 | $17,647 | $5,216 | $12,431 |
| 2014 | $612 | $20,192 | $5,216 | $14,976 |
Source: Public Records
Map
Nearby Homes
- 5454 Washington Rd
- 5494 Washington Rd
- 5530 Tubman Rd
- 478 Bonaventure Way
- 721 Pretoria Dr
- 5628 Tubman Rd
- 810 Glencoe Way
- 4027 Dewaal St
- 4025 Dewaal St
- 520 Jutland Way
- 4076 Dewaal St
- 510 Jutland Way
- 506 Windermere St
- 305 Buxton Ln
- 5416 Old Washington Rd
- 2824 Summit Ridge Rd
- 919 Pennington Way
- 462 Armstrong Way
- 422 Armstrong Way
- 129 Pond View Rd
- 3152 Johnson Dr
- 3156 Johnson Dr
- 3154 McCladdie Dr
- 3141 Johnson Dr
- 3139 Johnson Dr
- 3155 Johnson Dr
- 3161 McCladdie Dr
- 5468 Washington Rd
- 3162 Johnson Dr
- 5460 Washington Rd
- 3160 McCladdie Dr
- 3137 Johnson Dr
- 3163 McCladdie Dr
- 3165 Johnson Dr
- 5443 Washington Rd
- 3168 Johnson Dr
- 3168 McCladdie Dr
- 5470 Washington Rd
- 5448 Washington Rd
- 3170 McCladdie Dr
Your Personal Tour Guide
Ask me questions while you tour the home.