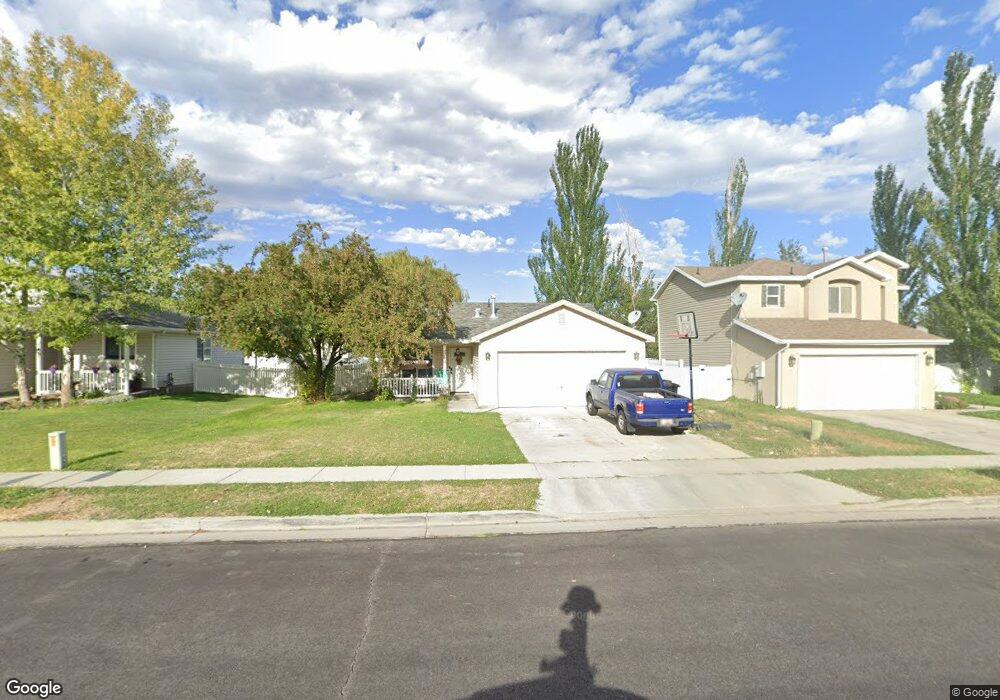
5465 Ardennes Way Tooele, UT 84074
Estimated Value: $377,000 - $410,476
3
Beds
1
Bath
1,177
Sq Ft
$334/Sq Ft
Est. Value
About This Home
This home is located at 5465 Ardennes Way, Tooele, UT 84074 and is currently estimated at $393,119, approximately $334 per square foot. 5465 Ardennes Way is a home located in Tooele County with nearby schools including Rose Springs Elementary School, Clarke N. Johnsen Junior High School, and Stansbury High School.
Ownership History
Date
Name
Owned For
Owner Type
Purchase Details
Closed on
Aug 19, 2021
Sold by
Maughan Jerel Thomas
Bought by
Maughan Aubrey Shaye
Current Estimated Value
Purchase Details
Closed on
May 8, 2014
Sold by
Argyle Allen J and Argyle Mary E
Bought by
Maughan Jerel
Home Financials for this Owner
Home Financials are based on the most recent Mortgage that was taken out on this home.
Original Mortgage
$8,650
Outstanding Balance
$6,597
Interest Rate
4.35%
Mortgage Type
Stand Alone Second
Estimated Equity
$386,522
Purchase Details
Closed on
Mar 14, 2008
Sold by
Turner Michael D and Turner Christa M
Bought by
Argyle Allen J and Argyle Mary E
Home Financials for this Owner
Home Financials are based on the most recent Mortgage that was taken out on this home.
Original Mortgage
$159,500
Interest Rate
5.65%
Mortgage Type
New Conventional
Create a Home Valuation Report for This Property
The Home Valuation Report is an in-depth analysis detailing your home's value as well as a comparison with similar homes in the area
Home Values in the Area
Average Home Value in this Area
Purchase History
| Date | Buyer | Sale Price | Title Company |
|---|---|---|---|
| Maughan Aubrey Shaye | -- | None Available | |
| Maughan Jerel | -- | Cottonwood Title Ins Agency | |
| Argyle Allen J | -- | First American Title Ins Ag |
Source: Public Records
Mortgage History
| Date | Status | Borrower | Loan Amount |
|---|---|---|---|
| Open | Maughan Jerel | $8,650 | |
| Previous Owner | Argyle Allen J | $159,500 |
Source: Public Records
Tax History Compared to Growth
Tax History
| Year | Tax Paid | Tax Assessment Tax Assessment Total Assessment is a certain percentage of the fair market value that is determined by local assessors to be the total taxable value of land and additions on the property. | Land | Improvement |
|---|---|---|---|---|
| 2025 | $2,949 | $372,772 | $128,000 | $244,772 |
| 2024 | $3,194 | $205,231 | $70,400 | $134,831 |
| 2023 | $3,194 | $181,559 | $76,450 | $105,109 |
| 2022 | $2,137 | $171,491 | $60,940 | $110,551 |
| 2021 | $2,021 | $133,983 | $54,065 | $79,918 |
| 2020 | $1,896 | $219,725 | $74,200 | $145,525 |
| 2019 | $1,753 | $199,863 | $74,200 | $125,663 |
| 2018 | $1,499 | $163,736 | $40,000 | $123,736 |
| 2017 | $1,366 | $157,844 | $40,000 | $117,844 |
| 2016 | $1,198 | $78,360 | $22,000 | $56,360 |
| 2015 | $1,198 | $75,170 | $0 | $0 |
| 2014 | -- | $75,170 | $0 | $0 |
Source: Public Records
Map
Nearby Homes
- 5502 Ardennes Way
- 5454 Heather Way
- 39 Strasbourg Ln
- 5546 Ardennes Way
- 5419 Heather Way
- 198 Clermont Ln
- 45 W Streams Edge Way
- 107 Pebble Beach Dr
- 5493 Lorraine Way
- 5584 N Gentle Breeze Ct
- 133 W Marigold Cir Unit 311
- 5581 Brienne Way
- 5531 Ponderosa Ln
- 62 Fairway Dr
- 5675 Lanyard Ln
- 5634 Miller Cir
- 5718 Lanyard Ln
- 5489 Hampton Way
- 5229 N Ventura Cir
- 138 W Morning Glory Cir
- 5465 Ardennes Way
- 5475 Ardennes Way
- 5457 Ardennes Way
- 5464 Scarsborough Way
- 5483 Ardennes Way
- 5449 Ardennes Way
- 5456 Scarsborough Way
- 5456 Scarsborough Way Unit 243
- 5472 Scarsborough Way
- 5448 Scarsborough Way
- 5491 Ardennes Way
- 5441 Ardennes Way
- 5482 Scarsborough Way
- 5464 Ardennes Way
- 5456 Ardennes Way
- 5442 Scarsborough Way
- 5480 Ardennes Way
- 5490 Scarsborough Way
- 5446 Ardennes Way
- 5486 Ardennes Way