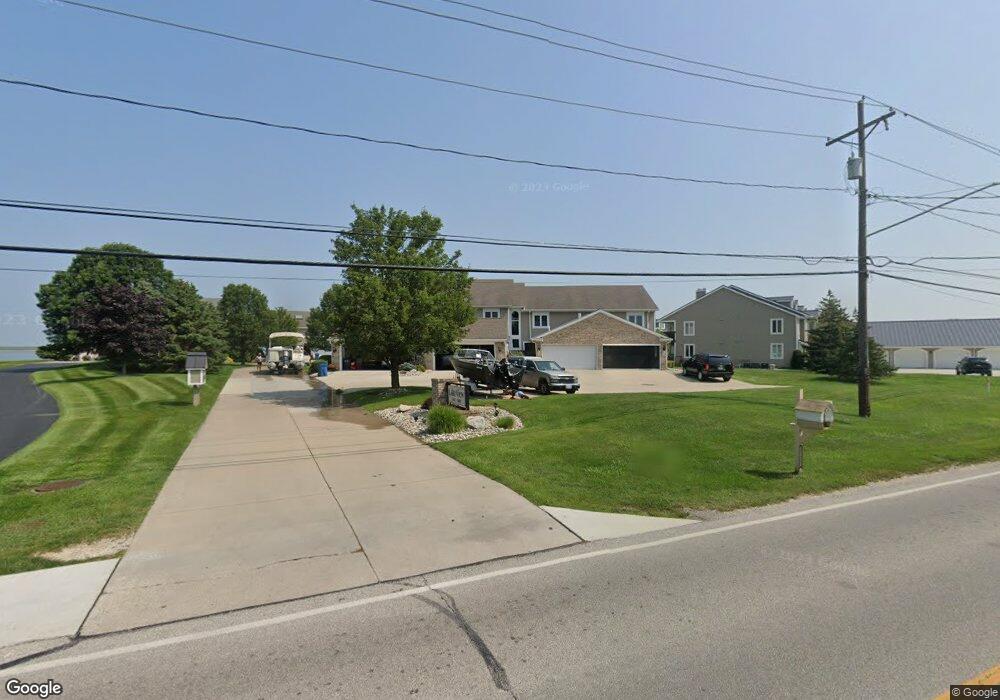
5465 Bayshore Rd Unit 5465 Oregon, OH 43616
Estimated Value: $374,000 - $411,493
2
Beds
3
Baths
2,445
Sq Ft
$157/Sq Ft
Est. Value
About This Home
This home is located at 5465 Bayshore Rd Unit 5465, Oregon, OH 43616 and is currently estimated at $384,873, approximately $157 per square foot. 5465 Bayshore Rd Unit 5465 is a home located in Lucas County.
Ownership History
Date
Name
Owned For
Owner Type
Purchase Details
Closed on
Feb 19, 2018
Sold by
Wolfe Erik J
Bought by
Wolfe Erik J and Bruley Colette M
Current Estimated Value
Purchase Details
Closed on
Aug 11, 2016
Sold by
Lacy Mark E
Bought by
Wolfe Erik J
Home Financials for this Owner
Home Financials are based on the most recent Mortgage that was taken out on this home.
Original Mortgage
$226,100
Outstanding Balance
$180,051
Interest Rate
3.42%
Mortgage Type
New Conventional
Estimated Equity
$204,822
Purchase Details
Closed on
Jul 6, 2004
Sold by
Lacy Mark E
Bought by
Lacy Mark E and Mark E Lacy Revocable Living Trust
Purchase Details
Closed on
Nov 19, 2002
Sold by
Benton Robert H and Benton Paula J
Bought by
Lacy Mark E
Home Financials for this Owner
Home Financials are based on the most recent Mortgage that was taken out on this home.
Original Mortgage
$216,500
Interest Rate
6.23%
Create a Home Valuation Report for This Property
The Home Valuation Report is an in-depth analysis detailing your home's value as well as a comparison with similar homes in the area
Home Values in the Area
Average Home Value in this Area
Purchase History
| Date | Buyer | Sale Price | Title Company |
|---|---|---|---|
| Wolfe Erik J | -- | None Available | |
| Wolfe Erik J | $238,000 | None Available | |
| Lacy Mark E | -- | -- | |
| Lacy Mark E | $241,500 | Port Lawrence Title |
Source: Public Records
Mortgage History
| Date | Status | Borrower | Loan Amount |
|---|---|---|---|
| Open | Wolfe Erik J | $226,100 | |
| Previous Owner | Lacy Mark E | $216,500 |
Source: Public Records
Tax History Compared to Growth
Tax History
| Year | Tax Paid | Tax Assessment Tax Assessment Total Assessment is a certain percentage of the fair market value that is determined by local assessors to be the total taxable value of land and additions on the property. | Land | Improvement |
|---|---|---|---|---|
| 2024 | $3,550 | $150,535 | $18,235 | $132,300 |
| 2023 | $5,322 | $96,005 | $14,700 | $81,305 |
| 2022 | $5,361 | $96,005 | $14,700 | $81,305 |
| 2021 | $5,404 | $96,005 | $14,700 | $81,305 |
| 2020 | $5,577 | $88,095 | $14,945 | $73,150 |
| 2019 | $5,418 | $88,095 | $14,945 | $73,150 |
| 2018 | $5,463 | $88,095 | $14,945 | $73,150 |
| 2017 | $5,642 | $86,065 | $14,595 | $71,470 |
| 2016 | $5,569 | $245,900 | $41,700 | $204,200 |
| 2015 | $5,628 | $245,900 | $41,700 | $204,200 |
| 2014 | $4,996 | $81,980 | $13,900 | $68,080 |
| 2013 | $4,996 | $81,980 | $13,900 | $68,080 |
Source: Public Records
Map
Nearby Homes
- 5243 Eagles Landing Dr
- 5911 Plympton Cir
- 1633 Grand Bay Dr
- 2057 Blanche Dr
- 2001 Lilias Dr
- 5305 Cedar Point Rd
- 2079 Arkansas St
- 140 N Wynn Rd
- 4263 Corduroy Rd
- 6530 Corduroy Rd
- 234 Avilyn Ln
- 5054 Magnolia Dr
- 5065 Magnolia Dr
- 5047 Noah Ln
- 3706 Corduroy Rd
- 5037 Easton Dr
- 5033 Easton Dr
- 5029 Easton Dr
- 5025 Easton Dr
- 5021 Easton Dr
- 5463 Bayshore Rd Unit 5463
- 5463 Bay Shore Rd
- 5463 Bay Shore Rd Unit 5463
- 5467 Bayshore Rd Unit 5467
- 5469 Bayshore Rd Unit 5469
- 5449 Bay Shore Rd
- 5447 Bayshore Rd
- 5829 Bay Shore Rd
- 5127 Bay Shore Rd
- 5451 Bayshore Rd Unit 5451
- 5449 Bayshore Rd Unit 5449
- 5453 Bayshore Rd Unit 5453
- 5473 Bayshore Rd Unit 5473
- 5442 Bayshore Rd Unit 5442
- 5432 Bayshore Rd Unit 5432
- 5435 Bayshore Rd
- 5489 Bayshore Rd
- 5501 Bayshore Rd
- 5491 Bayshore Rd Unit 5491
- 5438 Bayshore Rd Unit 5438