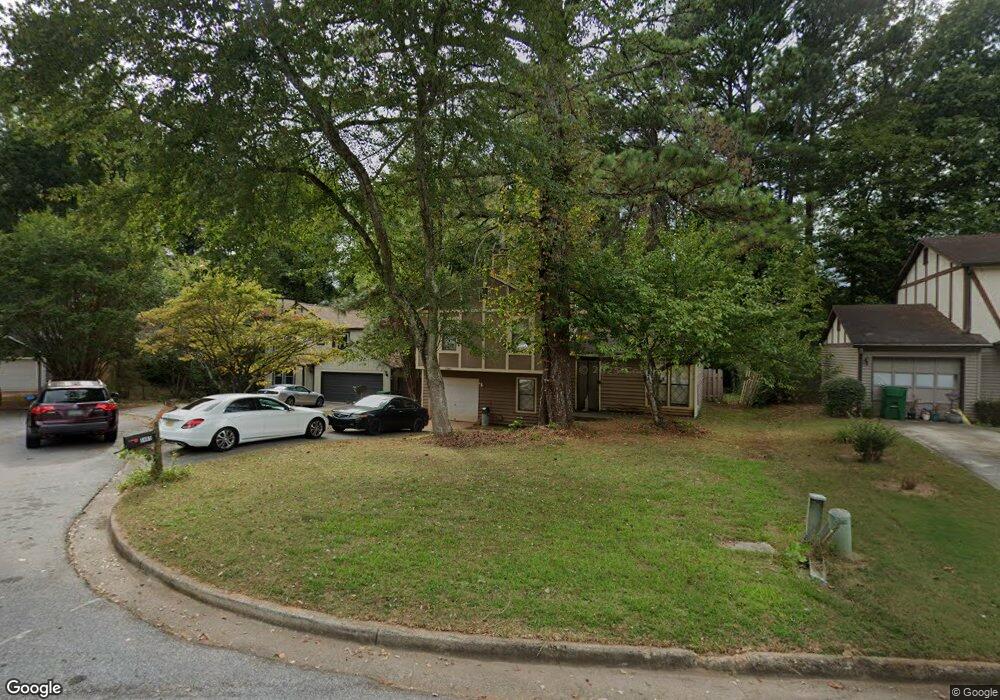
5465 Farmview Close Unit 7 Stone Mountain, GA 30088
Estimated Value: $216,000 - $233,000
3
Beds
3
Baths
1,382
Sq Ft
$163/Sq Ft
Est. Value
About This Home
This home is located at 5465 Farmview Close Unit 7, Stone Mountain, GA 30088 and is currently estimated at $225,583, approximately $163 per square foot. 5465 Farmview Close Unit 7 is a home located in DeKalb County with nearby schools including Shadow Rock Elementary School, Redan Middle School, and Redan High School.
Ownership History
Date
Name
Owned For
Owner Type
Purchase Details
Closed on
Aug 8, 2018
Sold by
Rha 1 Llc
Bought by
Fyr Sfr Borrower Llc and C/O Altisource Asset Management Corp
Current Estimated Value
Purchase Details
Closed on
Oct 1, 2014
Sold by
Gorilla Capital Ga 101 Llc
Bought by
Rha 1 Llc
Purchase Details
Closed on
Jan 15, 2014
Sold by
Pacific Northwest Investme
Bought by
Gorilla Capital Ga 101 Llc
Purchase Details
Closed on
Dec 12, 2013
Sold by
Burris Dorett
Bought by
Pacific Northwest Investments
Purchase Details
Closed on
Aug 21, 2013
Sold by
Black Castle Development L
Bought by
Burris Dorett A
Purchase Details
Closed on
Jun 5, 2012
Sold by
Dekalb County Tax Commissi
Bought by
Black Castle Development Llc
Purchase Details
Closed on
Feb 3, 1995
Sold by
Robinson Diane J Edward D
Bought by
Brown Dorett
Home Financials for this Owner
Home Financials are based on the most recent Mortgage that was taken out on this home.
Original Mortgage
$78,200
Interest Rate
7.75%
Mortgage Type
FHA
Create a Home Valuation Report for This Property
The Home Valuation Report is an in-depth analysis detailing your home's value as well as a comparison with similar homes in the area
Home Values in the Area
Average Home Value in this Area
Purchase History
| Date | Buyer | Sale Price | Title Company |
|---|---|---|---|
| Fyr Sfr Borrower Llc | $104,580 | -- | |
| Rha 1 Llc | $64,000 | -- | |
| Gorilla Capital Ga 101 Llc | $25,000 | -- | |
| Pacific Northwest Investments | -- | -- | |
| Burris Dorett A | $10,800 | -- | |
| Black Castle Development Llc | $10,100 | -- | |
| Brown Dorett | $8,500 | -- |
Source: Public Records
Mortgage History
| Date | Status | Borrower | Loan Amount |
|---|---|---|---|
| Previous Owner | Brown Dorett | $78,200 | |
| Closed | Brown Dorett | $8,500 |
Source: Public Records
Tax History
| Year | Tax Paid | Tax Assessment Tax Assessment Total Assessment is a certain percentage of the fair market value that is determined by local assessors to be the total taxable value of land and additions on the property. | Land | Improvement |
|---|---|---|---|---|
| 2025 | $4,689 | $97,600 | $19,520 | $78,080 |
| 2024 | $4,771 | $99,520 | $20,000 | $79,520 |
| 2023 | $4,771 | $57,280 | $7,200 | $50,080 |
Source: Public Records
Map
Nearby Homes
- 956 Forest Path
- 5471 Fox Valley Ln Unit 10
- 937 Fox Valley Ct
- 5397 Fox Valley Trace
- 1037 Forest Path Unit 3B
- 915 Fox Valley Ct
- 922 Fox Valley Ct
- 1045 Forest Path
- 1015 Sly Fox Ct
- 884 Forest Path
- 960 Stone Mountain Lithonia Rd
- 961 Redan Trace
- 5452 Forest Path Ct
- 5450 Fox Haven Trail
- 5349 Signal Ct
- 958 Redan Crescent
- 5472 Forest East Ln
- 868 Greenhedge Dr Unit 2
- 870 Chapman Cir
- 858 Chapman Cir
- 5465 Farmview Close
- 5459 Farmview Close Unit 6
- 5467 Farmview Close
- 5455 Farmview Close
- 5469 Farmview Close
- 786 Fox Valley Dr
- 782 Fox Valley Dr
- 5451 Farmview Close
- 5464 Farmview Close
- 5458 Farmview Close
- 790 Fox Valley Dr
- 985 Forest Path
- 5475 Farmview Close Unit 6
- 5475 Farmview Close
- 5471 Farmview Close
- 5445 Farmview Close Unit 6
- 5482 Farmview Close
- 989 Forest Path Unit 8
- 5454 Farmview Close
- 5479 Farmview Close
Your Personal Tour Guide
Ask me questions while you tour the home.