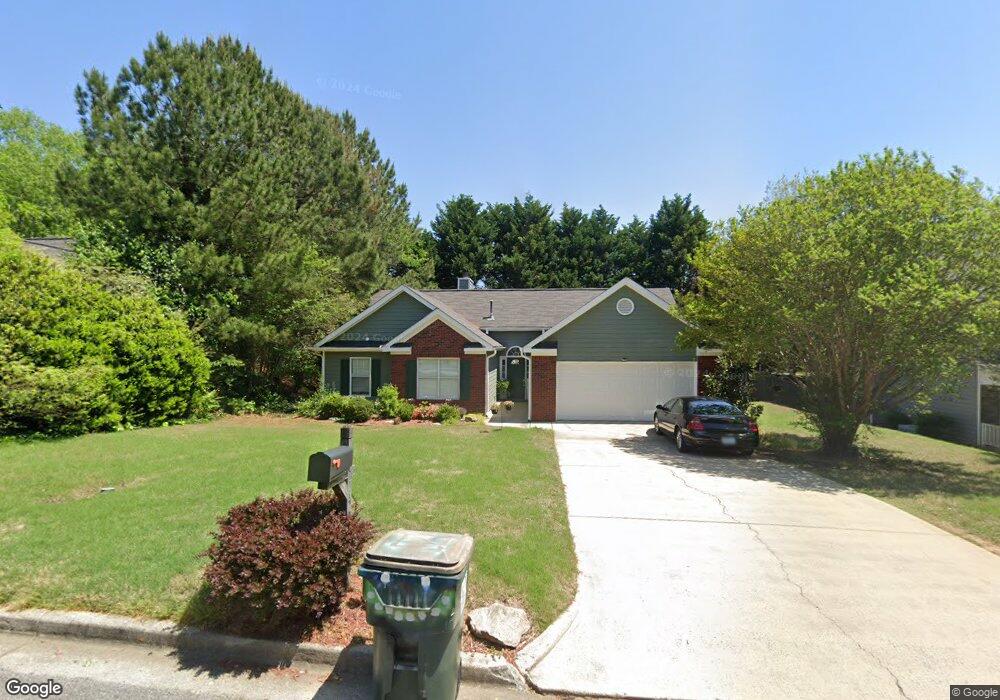
5465 Windswept Trace Sugar Hill, GA 30518
Estimated Value: $304,000 - $384,000
3
Beds
2
Baths
1,728
Sq Ft
$207/Sq Ft
Est. Value
About This Home
This home is located at 5465 Windswept Trace, Sugar Hill, GA 30518 and is currently estimated at $357,348, approximately $206 per square foot. 5465 Windswept Trace is a home located in Gwinnett County with nearby schools including Sycamore Elementary School, Lanier Middle School, and Lanier High School.
Ownership History
Date
Name
Owned For
Owner Type
Purchase Details
Closed on
Sep 21, 2010
Sold by
Mullenix Amy E
Bought by
Gonzalez Anthony J
Current Estimated Value
Purchase Details
Closed on
Mar 31, 2005
Sold by
Williams Brenda
Bought by
Mullenix Amy E
Home Financials for this Owner
Home Financials are based on the most recent Mortgage that was taken out on this home.
Original Mortgage
$149,650
Interest Rate
5.87%
Mortgage Type
New Conventional
Purchase Details
Closed on
Nov 21, 2003
Sold by
Vanvliet Hal B
Bought by
Williams Brenda
Home Financials for this Owner
Home Financials are based on the most recent Mortgage that was taken out on this home.
Original Mortgage
$133,887
Interest Rate
4.75%
Mortgage Type
New Conventional
Purchase Details
Closed on
Apr 30, 1997
Sold by
D Tel Inc
Bought by
Vanvliet Hal B
Home Financials for this Owner
Home Financials are based on the most recent Mortgage that was taken out on this home.
Original Mortgage
$109,900
Interest Rate
7.95%
Mortgage Type
New Conventional
Create a Home Valuation Report for This Property
The Home Valuation Report is an in-depth analysis detailing your home's value as well as a comparison with similar homes in the area
Home Values in the Area
Average Home Value in this Area
Purchase History
| Date | Buyer | Sale Price | Title Company |
|---|---|---|---|
| Gonzalez Anthony J | $110,000 | -- | |
| Mullenix Amy E | $149,700 | -- | |
| Williams Brenda | $141,000 | -- | |
| Vanvliet Hal B | $109,900 | -- |
Source: Public Records
Mortgage History
| Date | Status | Borrower | Loan Amount |
|---|---|---|---|
| Previous Owner | Mullenix Amy E | $149,650 | |
| Previous Owner | Williams Brenda | $133,887 | |
| Previous Owner | Vanvliet Hal B | $109,900 |
Source: Public Records
Tax History Compared to Growth
Tax History
| Year | Tax Paid | Tax Assessment Tax Assessment Total Assessment is a certain percentage of the fair market value that is determined by local assessors to be the total taxable value of land and additions on the property. | Land | Improvement |
|---|---|---|---|---|
| 2025 | $546 | $140,440 | $34,000 | $106,440 |
| 2024 | $4,805 | $137,680 | $28,800 | $108,880 |
| 2023 | $4,805 | $128,520 | $26,000 | $102,520 |
| 2022 | $4,260 | $121,720 | $22,000 | $99,720 |
| 2021 | $3,067 | $85,920 | $14,400 | $71,520 |
| 2020 | $3,048 | $85,920 | $14,400 | $71,520 |
| 2019 | $3,048 | $78,040 | $14,400 | $63,640 |
| 2018 | $2,814 | $71,680 | $12,000 | $59,680 |
| 2016 | $2,260 | $57,360 | $12,000 | $45,360 |
| 2015 | $1,486 | $36,800 | $9,200 | $27,600 |
| 2014 | -- | $36,800 | $9,200 | $27,600 |
Source: Public Records
Map
Nearby Homes
- 965 Garner Spring Ln
- 5557 Pinedale Cir
- 1181 Chastain Dr
- The Ellison II Plan at Ellison Square
- The Norwood II Plan at Ellison Square
- The Maddux II Plan at Ellison Square
- 1135 Chastain Dr
- 870 Long Branch Cir
- 850 Long Branch Cir
- 5605 Austin Garner Rd
- 978 Sugar Vista Cir
- 965 Sugar Meadow Dr
- 965 Under Ct
- 1025 Hunters Oak Trail
- 5330 Sycamore Rd
- 5166 Thorin Oak Cir Unit 7
- 5229 Pine Branch Ct
- 1150 Sycamore Creek Trail
- 5828 Paliser Trace
- 779 Avonley Creek Trace
- 5475 Windswept Trace
- 5455 Windswept Trace
- 978 Altavista Ct
- 973 Altavista Ct
- 5460 Windswept Trace
- 5470 Windswept Trace
- 5445 Windswept Trace
- 988 Altavista Ct
- 5515 Windswept Trace Unit 2
- 5450 Windswept Trace
- 5525 Windswept Trace
- 5480 Windswept Trace Unit 2
- 983 Altavista Ct Unit 2
- 5440 Windswept Trace
- 5440 Windswept Trace Unit 5440
- 5535 Windswept Trace
- 5435 Windswept Trace
- 5490 Windswept Trace
- 998 Altavista Ct
- 993 Altavista Ct