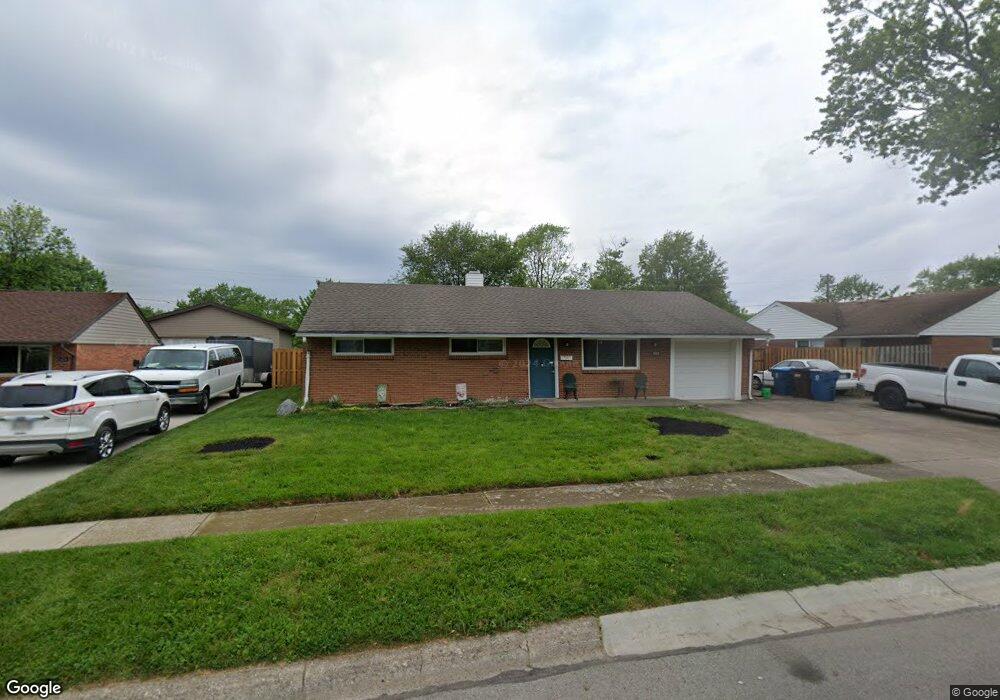
5466 Coleraine Dr Dayton, OH 45424
Estimated Value: $153,000 - $213,000
3
Beds
1
Bath
1,026
Sq Ft
$175/Sq Ft
Est. Value
About This Home
This home is located at 5466 Coleraine Dr, Dayton, OH 45424 and is currently estimated at $179,456, approximately $174 per square foot. 5466 Coleraine Dr is a home located in Montgomery County with nearby schools including Wayne High School and Huber Heights Christian Academy.
Ownership History
Date
Name
Owned For
Owner Type
Purchase Details
Closed on
Mar 8, 2021
Sold by
My Home Connection Llc
Bought by
Bogard Alan R and Bogard Julie J
Current Estimated Value
Home Financials for this Owner
Home Financials are based on the most recent Mortgage that was taken out on this home.
Original Mortgage
$97,500
Outstanding Balance
$87,402
Interest Rate
2.7%
Mortgage Type
New Conventional
Estimated Equity
$92,054
Purchase Details
Closed on
Oct 24, 2017
Sold by
The Bank Of New York Mellon Trust Compan
Bought by
Bogard Alan and Bogard Bogard
Purchase Details
Closed on
Apr 26, 2017
Sold by
Osorio Jorge M and Osorio Jorge
Bought by
The Bank Of New Yoek Mellon Trust Co and The Bank Of New York Trust Company Na
Purchase Details
Closed on
Dec 29, 2005
Sold by
Countrywide Home Loans Inc
Bought by
Osorio Jorge and Osorio Holly
Create a Home Valuation Report for This Property
The Home Valuation Report is an in-depth analysis detailing your home's value as well as a comparison with similar homes in the area
Home Values in the Area
Average Home Value in this Area
Purchase History
| Date | Buyer | Sale Price | Title Company |
|---|---|---|---|
| Bogard Alan R | -- | None Available | |
| Bogard Alan | $53,000 | None Available | |
| The Bank Of New Yoek Mellon Trust Co | $42,000 | None Available | |
| Osorio Jorge | $63,000 | Sovereign Title Agency Llc | |
| Countrywide Home Loans Inc | $63,000 | None Available |
Source: Public Records
Mortgage History
| Date | Status | Borrower | Loan Amount |
|---|---|---|---|
| Open | Bogard Alan R | $97,500 |
Source: Public Records
Tax History Compared to Growth
Tax History
| Year | Tax Paid | Tax Assessment Tax Assessment Total Assessment is a certain percentage of the fair market value that is determined by local assessors to be the total taxable value of land and additions on the property. | Land | Improvement |
|---|---|---|---|---|
| 2024 | $2,332 | $43,960 | $10,010 | $33,950 |
| 2023 | $2,332 | $43,960 | $10,010 | $33,950 |
| 2022 | $2,012 | $30,710 | $7,000 | $23,710 |
| 2021 | $2,044 | $30,710 | $7,000 | $23,710 |
| 2020 | $2,099 | $30,710 | $7,000 | $23,710 |
| 2019 | $1,989 | $25,710 | $7,000 | $18,710 |
| 2018 | $2,039 | $25,710 | $7,000 | $18,710 |
| 2017 | $2,332 | $25,710 | $7,000 | $18,710 |
| 2016 | $1,887 | $23,890 | $7,000 | $16,890 |
| 2015 | $1,863 | $23,890 | $7,000 | $16,890 |
| 2014 | $1,863 | $23,890 | $7,000 | $16,890 |
| 2012 | -- | $25,430 | $8,750 | $16,680 |
Source: Public Records
Map
Nearby Homes
- 5248 Tilbury Rd
- 6529 Harshmanville Rd
- 5625 Copley Cir
- 5926 Chambersburg Rd
- 6673 Celestine St
- 5159 Fishburg Rd
- 5080 Tilbury Rd
- 6109 Ansbury Dr
- 6100 Farmborough Dr
- 5983 Harshmanville Rd
- 5004 Fishburg Rd
- 5488 Flotron Dr
- 5455 Flotron Dr
- 5893 Tomberg St
- 4944 Chesham Dr
- 5952 Tibet Dr
- 6800 Cicero Ct
- 5848 Tomberg St
- 5904 Troy Villa Blvd Unit 20051
- 6246 Old Troy Pike
- 5458 Coleraine Dr
- 5474 Coleraine Dr
- 5342 Cranwell Cir
- 5467 Coleraine Dr
- 5347 Cranwell Cir
- 5475 Coleraine Dr
- 5442 Coleraine Dr
- 5482 Coleraine Dr
- 5334 Cranwell Cir
- 5459 Coleraine Dr
- 5424 Coleraine Dr
- 5341 Tilbury Rd
- 5483 Coleraine Dr
- 5416 Coleraine Dr
- 5326 Cranwell Cir
- 5339 Cranwell Cir
- 5333 Tilbury Rd
- 5331 Cranwell Cir
- 5408 Coleraine Dr
- 5447 Coleraine Dr