Estimated Value: $423,000 - $444,000
2
Beds
1
Bath
1,429
Sq Ft
$303/Sq Ft
Est. Value
About This Home
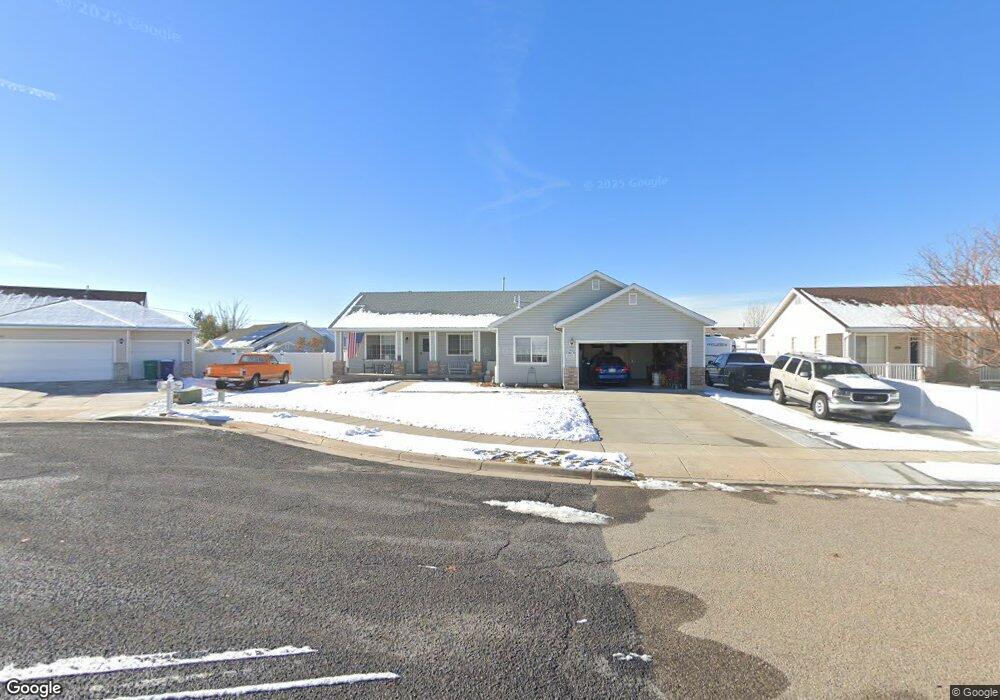
This home is located at 5467 S 4025 W, Roy, UT 84067 and is currently estimated at $433,122, approximately $303 per square foot. 5467 S 4025 W is a home located in Weber County with nearby schools including Freedom School, Roy Junior High School, and Roy High School.
Ownership History
Date
Name
Owned For
Owner Type
Purchase Details
Closed on
May 26, 2020
Sold by
Dickerson Marina A
Bought by
Dickerson Marina Ann and The Marina Ann Dickerson Living Trust
Current Estimated Value
Purchase Details
Closed on
Jan 22, 1998
Sold by
R & W Majestic Development Llc
Bought by
Dickerson Marina
Home Financials for this Owner
Home Financials are based on the most recent Mortgage that was taken out on this home.
Original Mortgage
$105,600
Outstanding Balance
$18,311
Interest Rate
7.13%
Estimated Equity
$414,811
Create a Home Valuation Report for This Property
The Home Valuation Report is an in-depth analysis detailing your home's value as well as a comparison with similar homes in the area
Home Values in the Area
Average Home Value in this Area
Purchase History
| Date | Buyer | Sale Price | Title Company |
|---|---|---|---|
| Dickerson Marina Ann | -- | None Available | |
| Dickerson Marina | -- | Cardon Land Title |
Source: Public Records
Mortgage History
| Date | Status | Borrower | Loan Amount |
|---|---|---|---|
| Open | Dickerson Marina | $105,600 |
Source: Public Records
Tax History
| Year | Tax Paid | Tax Assessment Tax Assessment Total Assessment is a certain percentage of the fair market value that is determined by local assessors to be the total taxable value of land and additions on the property. | Land | Improvement |
|---|---|---|---|---|
| 2025 | $2,647 | $420,224 | $128,561 | $291,663 |
| 2024 | $2,561 | $224,949 | $70,708 | $154,241 |
| 2023 | $2,481 | $218,350 | $66,744 | $151,606 |
| 2022 | $2,572 | $233,750 | $58,938 | $174,812 |
| 2021 | $2,016 | $299,000 | $81,562 | $217,438 |
| 2020 | $1,954 | $267,000 | $81,562 | $185,438 |
| 2019 | $1,876 | $241,000 | $46,247 | $194,753 |
| 2018 | $1,722 | $207,000 | $43,303 | $163,697 |
| 2017 | $1,588 | $178,000 | $43,303 | $134,697 |
| 2016 | $1,555 | $93,854 | $22,430 | $71,424 |
| 2015 | $1,361 | $83,220 | $22,430 | $60,790 |
| 2014 | $1,334 | $80,499 | $19,696 | $60,803 |
Source: Public Records
Map
Nearby Homes
- 5444 S 4050 W
- 5412 S 3925 W
- 3832 W 5625 S
- 4239 W 5325 S
- 4309 W 5430 St #B S
- 3826 W 5750 S
- 5773 S 3850 W
- 4216 W 5250 S
- 4277 W 5250 S
- 5856 S 3950 W
- 4088 W 5050 S
- 4218 W 5050 S
- 4403 W 5700 S
- 5035 S 4275 W
- 4450 W 5775 S
- 4950 3900 West St
- 3443 W 5200 S Unit 2&3
- 4264 W 6025 S
- 4276 W 6025 S
- 4853 S 4275 W Unit 27
Your Personal Tour Guide
Ask me questions while you tour the home.