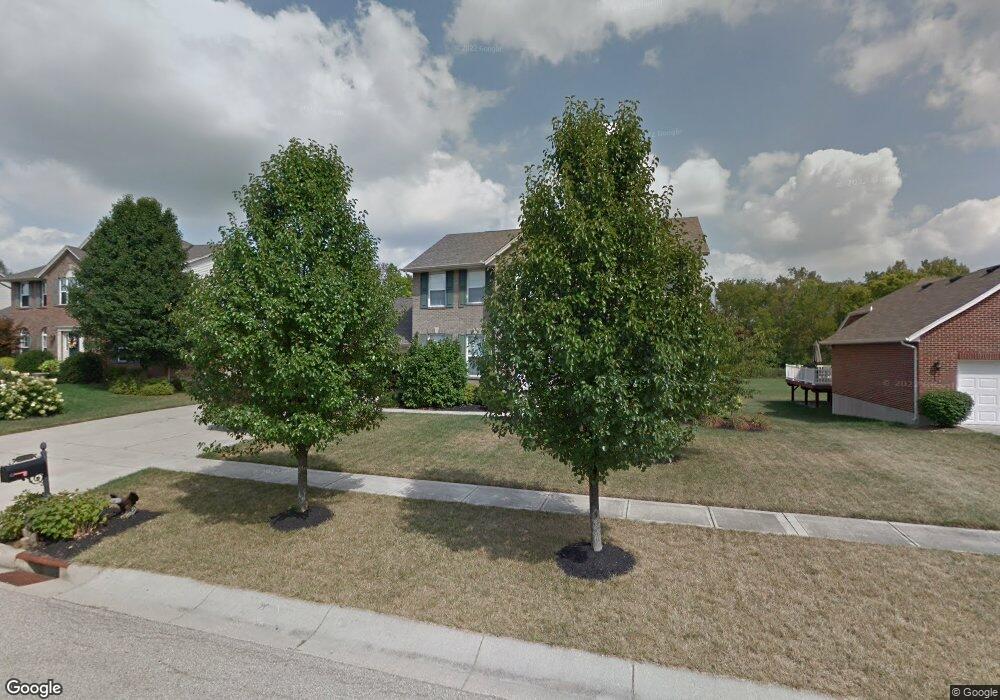
5468 Panther Run Liberty Township, OH 45044
Estimated Value: $541,056 - $593,000
4
Beds
4
Baths
3,698
Sq Ft
$152/Sq Ft
Est. Value
About This Home
This home is located at 5468 Panther Run, Liberty Township, OH 45044 and is currently estimated at $562,514, approximately $152 per square foot. 5468 Panther Run is a home located in Butler County with nearby schools including VanGorden Elementary School, Liberty Junior School, and Lakota East High School.
Ownership History
Date
Name
Owned For
Owner Type
Purchase Details
Closed on
Dec 4, 2012
Sold by
Slicker Juliann G
Bought by
Slicker Todd C
Current Estimated Value
Purchase Details
Closed on
Jun 23, 2008
Sold by
Roth John J and Roth Linda M
Bought by
Slicker Todd C and Slicker Juliann
Home Financials for this Owner
Home Financials are based on the most recent Mortgage that was taken out on this home.
Original Mortgage
$218,400
Interest Rate
6.05%
Mortgage Type
Purchase Money Mortgage
Purchase Details
Closed on
Nov 12, 2003
Sold by
Schmidt Builders Inc
Bought by
Roth John J and Roth Linda M
Home Financials for this Owner
Home Financials are based on the most recent Mortgage that was taken out on this home.
Original Mortgage
$198,300
Interest Rate
6.1%
Mortgage Type
Purchase Money Mortgage
Create a Home Valuation Report for This Property
The Home Valuation Report is an in-depth analysis detailing your home's value as well as a comparison with similar homes in the area
Home Values in the Area
Average Home Value in this Area
Purchase History
| Date | Buyer | Sale Price | Title Company |
|---|---|---|---|
| Slicker Todd C | -- | None Available | |
| Slicker Todd C | $273,000 | Attorney | |
| Roth John J | $250,887 | -- |
Source: Public Records
Mortgage History
| Date | Status | Borrower | Loan Amount |
|---|---|---|---|
| Previous Owner | Slicker Todd C | $218,400 | |
| Previous Owner | Roth John J | $198,300 |
Source: Public Records
Tax History Compared to Growth
Tax History
| Year | Tax Paid | Tax Assessment Tax Assessment Total Assessment is a certain percentage of the fair market value that is determined by local assessors to be the total taxable value of land and additions on the property. | Land | Improvement |
|---|---|---|---|---|
| 2024 | $6,014 | $151,370 | $19,870 | $131,500 |
| 2023 | $5,936 | $149,940 | $19,870 | $130,070 |
| 2022 | $5,010 | $99,800 | $19,870 | $79,930 |
| 2021 | $4,984 | $99,800 | $19,870 | $79,930 |
| 2020 | $5,106 | $99,800 | $19,870 | $79,930 |
| 2019 | $9,160 | $95,090 | $20,030 | $75,060 |
| 2018 | $5,361 | $93,740 | $20,030 | $73,710 |
| 2017 | $5,437 | $93,740 | $20,030 | $73,710 |
| 2016 | $4,947 | $84,860 | $20,030 | $64,830 |
| 2015 | $4,877 | $84,860 | $20,030 | $64,830 |
| 2014 | $5,103 | $84,860 | $20,030 | $64,830 |
| 2013 | $5,103 | $84,140 | $20,030 | $64,110 |
Source: Public Records
Map
Nearby Homes
- 5542 Safari Dr
- 6534 Justess Ln
- 6551 Lucky Ln
- 5502 Rodeo Dr
- 6466 Winding Oaks Dr
- 6035 Kyles Station Rd
- 6394 Ashdale Ct
- 5725 Hawthrone Reserve Dr
- 6777 Mahogany Ct
- 6895 Welney Run
- 5051 Cavendish Dr
- 5798 Roden Park Dr
- 7025 Welney Run
- 5290 Bligh Ct
- 7081 Yankee Estates Dr
- 7095 Kyles Station Rd
- 7104 Paul Ln
- 5905 Brunswick Ct
- 5019 Yankee Rd
- 6512 Devon Dr
- 5458 Panther Run
- 5478 Panther Run
- 2 Panther Run
- 5448 Panther Run
- 5488 Panther Run
- 6391 Prairie Ct
- 5479 Panther Run
- 6394 Prairie Ct
- 5438 Panther Run
- 5498 Panther Run
- 5519 Panther Run
- 5439 Panther Run
- 6384 Prairie Ct
- 6371 Prairie Ct
- 5529 Panther Run
- 5508 Panther Run
- 6374 Prairie Ct
- 5518 Panther Run
- 6361 Prairie Ct
- 5539 Panther Run