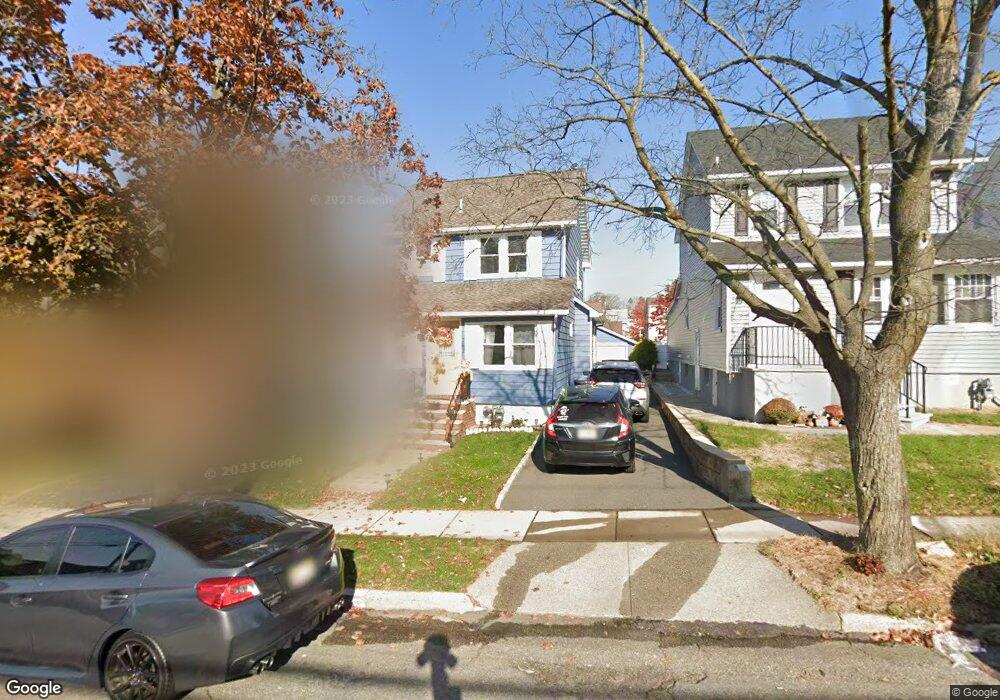
547 5th Ave Lyndhurst, NJ 07071
Estimated Value: $574,000 - $712,000
3
Beds
2
Baths
1,460
Sq Ft
$428/Sq Ft
Est. Value
About This Home
This home is located at 547 5th Ave, Lyndhurst, NJ 07071 and is currently estimated at $625,411, approximately $428 per square foot. 547 5th Ave is a home located in Bergen County with nearby schools including Lyndhurst High School, Hudson Arts and Sciences Charter School, and St Clare Elementary School.
Ownership History
Date
Name
Owned For
Owner Type
Purchase Details
Closed on
Mar 20, 2018
Sold by
Mehta Harish and Mehta Gitu
Bought by
Sinchi Marco and Sincho Gladys E
Current Estimated Value
Purchase Details
Closed on
Nov 1, 2010
Sold by
Cifelli Nicolino and Cifelli Lucille
Bought by
Mehta Harish and Mehta Gitu
Home Financials for this Owner
Home Financials are based on the most recent Mortgage that was taken out on this home.
Original Mortgage
$339,625
Interest Rate
4.22%
Mortgage Type
Purchase Money Mortgage
Purchase Details
Closed on
Dec 21, 2009
Sold by
Breen Rosemarie and Degregorio Nicholas
Bought by
Cifelli Nicolino and Cifelli Lucille
Create a Home Valuation Report for This Property
The Home Valuation Report is an in-depth analysis detailing your home's value as well as a comparison with similar homes in the area
Home Values in the Area
Average Home Value in this Area
Purchase History
| Date | Buyer | Sale Price | Title Company |
|---|---|---|---|
| Sinchi Marco | $345,000 | -- | |
| Mehta Harish | $357,500 | -- | |
| Cifelli Nicolino | $222,500 | -- |
Source: Public Records
Mortgage History
| Date | Status | Borrower | Loan Amount |
|---|---|---|---|
| Previous Owner | Mehta Harish | $339,625 |
Source: Public Records
Tax History
| Year | Tax Paid | Tax Assessment Tax Assessment Total Assessment is a certain percentage of the fair market value that is determined by local assessors to be the total taxable value of land and additions on the property. | Land | Improvement |
|---|---|---|---|---|
| 2025 | $9,412 | $451,800 | $250,600 | $201,200 |
| 2024 | $9,061 | $451,200 | $248,600 | $202,600 |
| 2023 | $8,244 | $445,900 | $245,600 | $200,300 |
| 2022 | $8,244 | $259,900 | $148,500 | $111,400 |
| 2021 | $7,901 | $259,900 | $148,500 | $111,400 |
| 2020 | $7,729 | $259,900 | $148,500 | $111,400 |
| 2019 | $7,672 | $259,900 | $148,500 | $111,400 |
| 2018 | $7,735 | $259,900 | $148,500 | $111,400 |
| 2017 | $7,540 | $259,900 | $148,500 | $111,400 |
| 2016 | $7,371 | $259,900 | $148,500 | $111,400 |
| 2015 | $7,139 | $259,900 | $148,500 | $111,400 |
| 2014 | $7,046 | $259,900 | $148,500 | $111,400 |
Source: Public Records
Map
Nearby Homes
- 631 6th Ave
- 317 Ridge Rd
- 539 Freeman St
- 331 Mountain Way
- 121 Woodland Ave
- 217 Mountain Way
- 648 Milton Ave
- 222 Ridge Rd
- 54 Stuyvesant Ave
- 232 Stuyvesant Ave
- 319 Ridge Rd
- 659 Valley Brook Ave
- 249 Court Ave Unit 51
- 11 W Gouverneur Ave
- 245 Court Ave Unit 7
- 135 Jay Ave
- 34 Kearney St
- 36 Kearney St
- 207 Lafayette Ave
- 252 Oriental Place
Your Personal Tour Guide
Ask me questions while you tour the home.