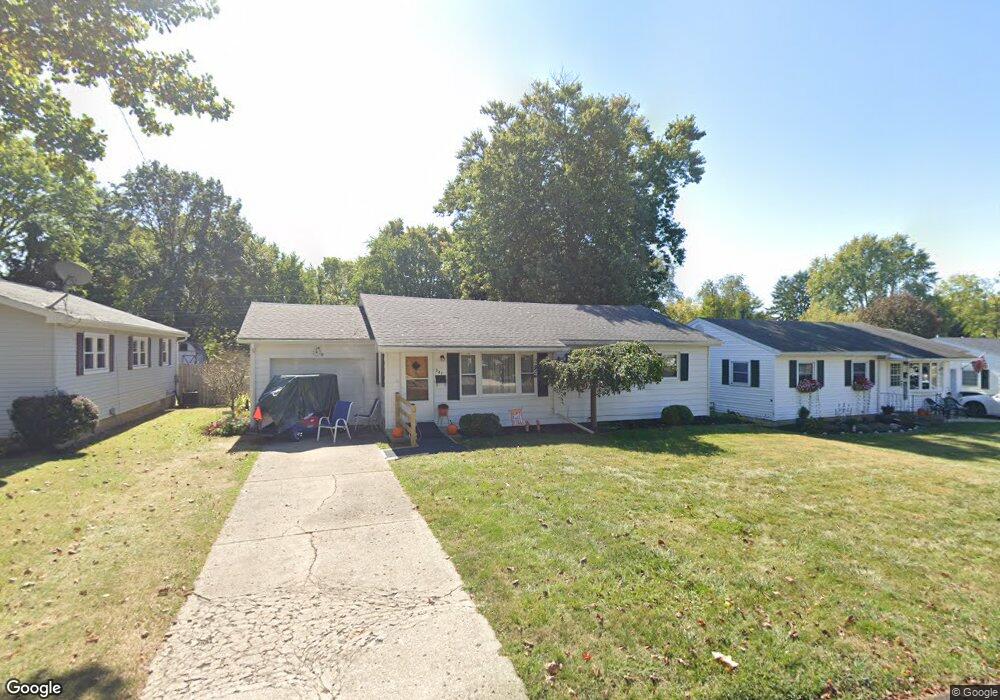
547 E Light St Urbana, OH 43078
Estimated Value: $181,482 - $216,000
3
Beds
2
Baths
1,064
Sq Ft
$192/Sq Ft
Est. Value
About This Home
This home is located at 547 E Light St, Urbana, OH 43078 and is currently estimated at $204,621, approximately $192 per square foot. 547 E Light St is a home located in Champaign County with nearby schools including Urbana Elementary School, Urbana Junior High School, and Urbana High School.
Ownership History
Date
Name
Owned For
Owner Type
Purchase Details
Closed on
Aug 26, 2022
Sold by
Valerie Smith
Bought by
Smith Stephen J
Current Estimated Value
Purchase Details
Closed on
Dec 14, 2019
Sold by
Smith Stephen J and Smith Stephen J
Bought by
Smith Stephen J and Smith Valerie L
Home Financials for this Owner
Home Financials are based on the most recent Mortgage that was taken out on this home.
Original Mortgage
$102,000
Interest Rate
3.6%
Mortgage Type
New Conventional
Purchase Details
Closed on
Mar 28, 2018
Sold by
Smtih Sharon K
Bought by
Smith Stephen J
Create a Home Valuation Report for This Property
The Home Valuation Report is an in-depth analysis detailing your home's value as well as a comparison with similar homes in the area
Home Values in the Area
Average Home Value in this Area
Purchase History
| Date | Buyer | Sale Price | Title Company |
|---|---|---|---|
| Smith Stephen J | -- | -- | |
| Smith Stephen J | -- | None Available | |
| Smith Stephen J | -- | None Available |
Source: Public Records
Mortgage History
| Date | Status | Borrower | Loan Amount |
|---|---|---|---|
| Previous Owner | Smith Stephen J | $102,000 |
Source: Public Records
Tax History
| Year | Tax Paid | Tax Assessment Tax Assessment Total Assessment is a certain percentage of the fair market value that is determined by local assessors to be the total taxable value of land and additions on the property. | Land | Improvement |
|---|---|---|---|---|
| 2024 | $1,665 | $34,710 | $3,240 | $31,470 |
| 2023 | $1,460 | $34,710 | $3,240 | $31,470 |
| 2022 | $1,489 | $34,710 | $3,240 | $31,470 |
| 2021 | $1,299 | $26,830 | $2,590 | $24,240 |
| 2020 | $1,299 | $26,830 | $2,590 | $24,240 |
| 2019 | $1,283 | $26,830 | $2,590 | $24,240 |
| 2018 | $659 | $22,230 | $2,230 | $20,000 |
| 2017 | $655 | $22,230 | $2,230 | $20,000 |
| 2016 | $656 | $22,230 | $2,230 | $20,000 |
| 2015 | $628 | $21,270 | $2,230 | $19,040 |
| 2014 | $644 | $21,270 | $2,230 | $19,040 |
| 2013 | $496 | $21,270 | $2,230 | $19,040 |
Source: Public Records
Map
Nearby Homes
- 501 E Light St
- 511 Washington Ave
- 581 Washington Ave
- 217 Lincoln Place
- 110 Lincoln Place
- 836 & 842 N Main St
- 123 Washington Ave
- 543 E Court St
- 655 Louden St
- 596 Scioto St
- 242 Laurel Oak St
- 427 N Walnut St
- 727 N Russell St
- 709 N Russell St
- 214 Scioto St
- 344 E Market St
- 417 N Russell St
- 328 W Church St
- 328 W Church St Unit 328-330
- 127 Miami St
Your Personal Tour Guide
Ask me questions while you tour the home.