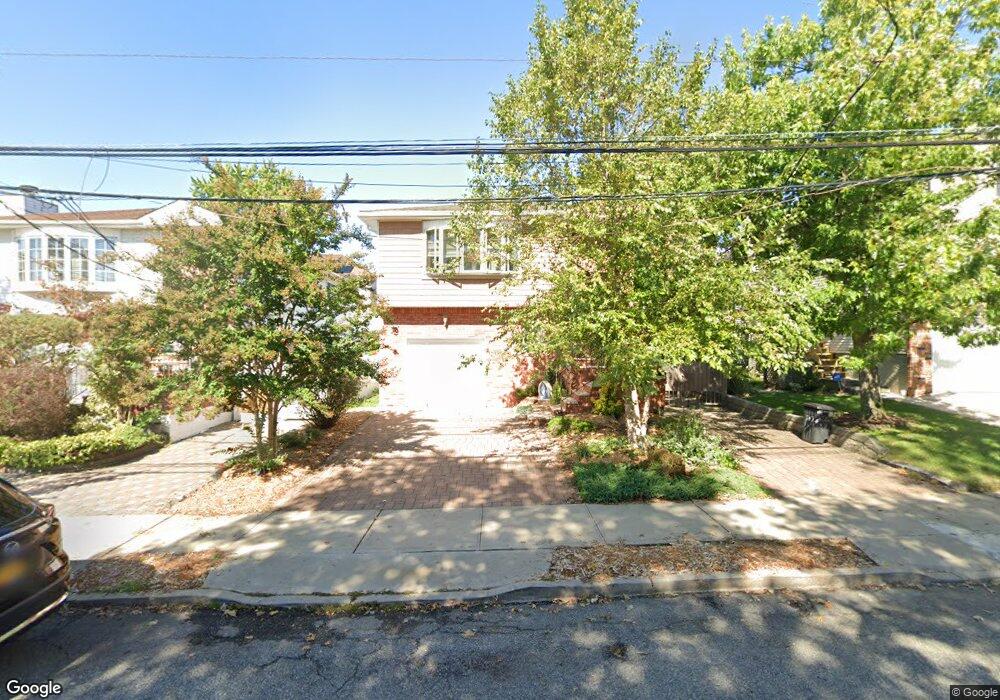
547 Edgegrove Ave Unit 2 Staten Island, NY 10312
Huguenot NeighborhoodEstimated Value: $987,217 - $1,132,000
5
Beds
4
Baths
2,450
Sq Ft
$435/Sq Ft
Est. Value
About This Home
This home is located at 547 Edgegrove Ave Unit 2, Staten Island, NY 10312 and is currently estimated at $1,065,804, approximately $435 per square foot. 547 Edgegrove Ave Unit 2 is a home located in Richmond County with nearby schools including P.S. 36 - J.C. Drumgoole, I.S. 075 Frank D. Paulo, and Tottenville High School.
Ownership History
Date
Name
Owned For
Owner Type
Purchase Details
Closed on
Aug 13, 2008
Sold by
Urcinoli Joan
Bought by
Santamaria Anthony and Valiente Maria
Current Estimated Value
Home Financials for this Owner
Home Financials are based on the most recent Mortgage that was taken out on this home.
Original Mortgage
$515,214
Outstanding Balance
$339,309
Interest Rate
6.4%
Mortgage Type
FHA
Estimated Equity
$726,495
Purchase Details
Closed on
May 18, 2006
Sold by
Urcinoli Joan and Estate Of Louis Urcinoli
Bought by
Urcinoli Joan
Home Financials for this Owner
Home Financials are based on the most recent Mortgage that was taken out on this home.
Original Mortgage
$210,000
Interest Rate
6.55%
Mortgage Type
New Conventional
Create a Home Valuation Report for This Property
The Home Valuation Report is an in-depth analysis detailing your home's value as well as a comparison with similar homes in the area
Home Values in the Area
Average Home Value in this Area
Purchase History
| Date | Buyer | Sale Price | Title Company |
|---|---|---|---|
| Santamaria Anthony | $540,000 | Chicago Title Insurance Co | |
| Urcinoli Joan | -- | Chicago Title Insurance Co |
Source: Public Records
Mortgage History
| Date | Status | Borrower | Loan Amount |
|---|---|---|---|
| Open | Santamaria Anthony | $515,214 | |
| Previous Owner | Urcinoli Joan | $210,000 |
Source: Public Records
Tax History Compared to Growth
Tax History
| Year | Tax Paid | Tax Assessment Tax Assessment Total Assessment is a certain percentage of the fair market value that is determined by local assessors to be the total taxable value of land and additions on the property. | Land | Improvement |
|---|---|---|---|---|
| 2025 | $10,816 | $59,520 | $11,198 | $48,322 |
| 2024 | $10,816 | $56,820 | $11,145 | $45,675 |
| 2023 | $10,318 | $50,803 | $11,101 | $39,702 |
| 2022 | $10,107 | $53,280 | $11,760 | $41,520 |
| 2021 | $10,278 | $48,840 | $11,760 | $37,080 |
| 2020 | $9,998 | $50,340 | $11,760 | $38,580 |
| 2019 | $9,387 | $54,600 | $11,760 | $42,840 |
| 2018 | $8,333 | $42,336 | $10,464 | $31,872 |
| 2017 | $8,301 | $42,192 | $11,631 | $30,561 |
| 2016 | $7,978 | $41,460 | $11,760 | $29,700 |
| 2015 | $6,872 | $39,360 | $9,780 | $29,580 |
| 2014 | $6,872 | $37,396 | $9,630 | $27,766 |
Source: Public Records
Map
Nearby Homes
- 488 Ionia Ave
- 0 Ionia Ave
- 416 Rathbun Ave
- 528 Rathbun Ave
- 517 Rathbun Ave
- 452 Rensselaer Ave
- 265 Ramona Ave
- 529 Sheldon Ave
- 274 S Railroad St
- 645 Lamont Ave
- 694 Edgegrove Ave Unit 715
- 172 N Railroad St
- 00 Sheldon Ave
- 164 N Railroad St
- 295 Rensselaer Ave
- 291 Rensselaer Ave
- 525 Sinclair Ave
- 382 Edgegrove Ave
- 728 Huguenot Ave
- 267 Bennett Ave
- 547 Edgegrove Ave
- 551 Edgegrove Ave
- 543 Edgegrove Ave
- 316 Delmar Ave
- 555 Edgegrove Ave
- 528 Ionia Ave
- 310 Delmar Ave
- 559 Edgegrove Ave
- 536 Ionia Ave
- 330 Delmar Ave
- 304 Delmar Ave
- 542 Edgegrove Ave
- 252 Edgegrove Ave
- 0 Edgegrove Ave
- 550 Edgegrove Ave
- 565 Edgegrove Ave
- 544 Ionia Ave
- 560 Edgegrove Ave
- 338 Delmar Ave
- 550 Ionia Ave