
Seller's Agent in 2025
James Ross
Red 1 Realty
(614) 505-5656
20 in this area
1,080 Total Sales
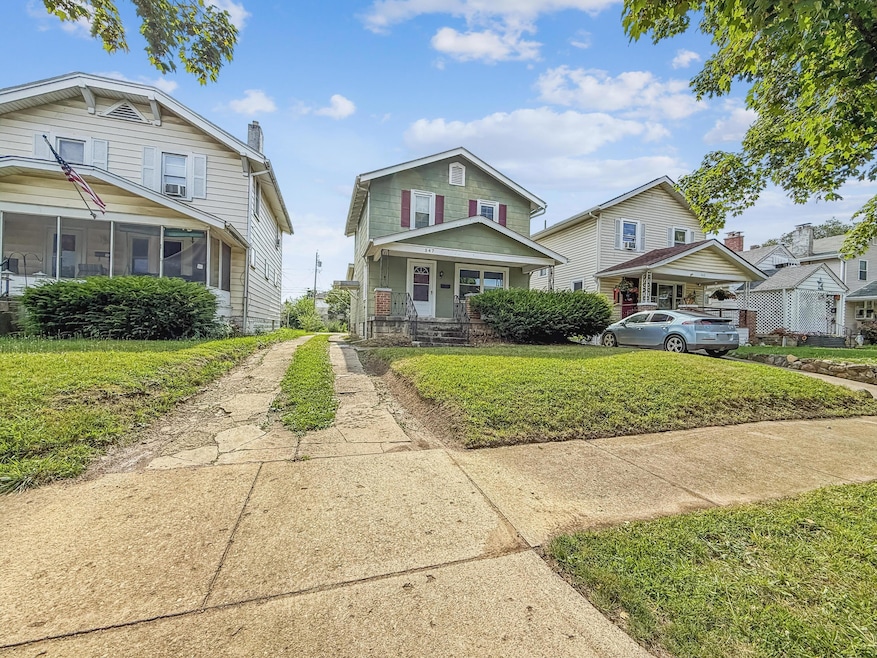
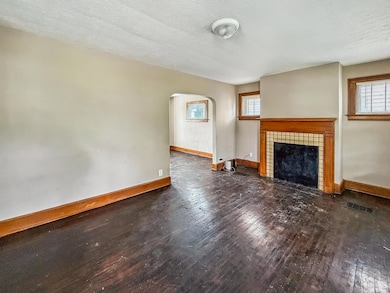
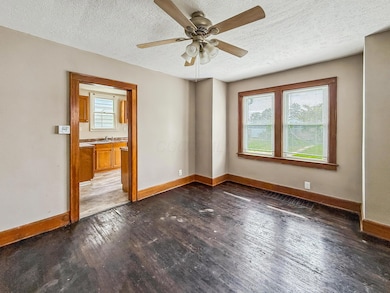
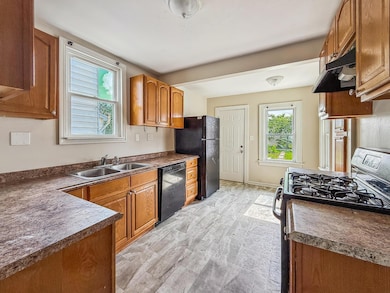
Spacious and full of potential, this 2-bed, 1-bath home sits in a neighborhood buzzing with investor activity. With all the essentials already in place, it just needs your finishing touches to shine. A smart addition to any portfolio -whether you're flipping, renting, or calling it your own, the upside is clear! See A2A.
| Date | Type | Sale Price | Title Company |
|---|---|---|---|
| Special Warranty Deed | $120,000 | Total Title Services | |
| Warranty Deed | $59,000 | Total Title Services | |
| Warranty Deed | $53,000 | Total Title Services | |
| Warranty Deed | $45,500 | None Available | |
| Warranty Deed | $4,600 | Chicago Tit | |
| Deed | $13,547 | Lakeside Ti | |
| Sheriffs Deed | $34,000 | None Available | |
| Special Warranty Deed | -- | Attorney |
| Date | Status | Loan Amount | Loan Type |
|---|---|---|---|
| Open | $124,000 | New Conventional |
| Date | Event | Price | List to Sale | Price per Sq Ft |
|---|---|---|---|---|
| 08/15/2025 08/15/25 | Sold | $120,000 | -7.6% | $115 / Sq Ft |
| 07/29/2025 07/29/25 | Pending | -- | -- | -- |
| 07/11/2025 07/11/25 | For Sale | $129,900 | -- | $124 / Sq Ft |
| Year | Tax Paid | Tax Assessment Tax Assessment Total Assessment is a certain percentage of the fair market value that is determined by local assessors to be the total taxable value of land and additions on the property. | Land | Improvement |
|---|---|---|---|---|
| 2024 | $1,787 | $38,990 | $5,180 | $33,810 |
| 2023 | $1,765 | $38,990 | $5,180 | $33,810 |
| 2022 | $1,270 | $19,920 | $1,960 | $17,960 |
| 2021 | $1,108 | $19,920 | $1,960 | $17,960 |
| 2020 | $1,267 | $19,920 | $1,960 | $17,960 |
| 2019 | $1,150 | $18,490 | $1,650 | $16,840 |
| 2018 | $1,102 | $18,490 | $1,650 | $16,840 |
| 2017 | $1,095 | $18,490 | $1,650 | $16,840 |
| 2016 | $990 | $13,830 | $4,060 | $9,770 |
| 2015 | $905 | $13,830 | $4,060 | $9,770 |
| 2014 | $858 | $13,830 | $4,060 | $9,770 |
| 2013 | $484 | $16,275 | $4,795 | $11,480 |
Seller's Agent in 2025
James Ross
Red 1 Realty
(614) 505-5656
20 in this area
1,080 Total Sales
Buyer's Agent in 2025
Drew Hensel
RE/MAX
(614) 915-6847
2 in this area
285 Total Sales
Source: Columbus and Central Ohio Regional MLS
MLS Number: 225025606
APN: 010-067827
Disclaimer: Certain information contained herein is derived from information provided by parties other than Homes.com. All information provided is deemed reliable, but is not guaranteed to be accurate and should be independently verified.
![]() IDX information is provided exclusively for personal, non-commercial use, and may not be used for any purpose other than to identify prospective properties consumers may be interested in purchasing.
IDX information is provided exclusively for personal, non-commercial use, and may not be used for any purpose other than to identify prospective properties consumers may be interested in purchasing.
Information is deemed reliable but not guaranteed.