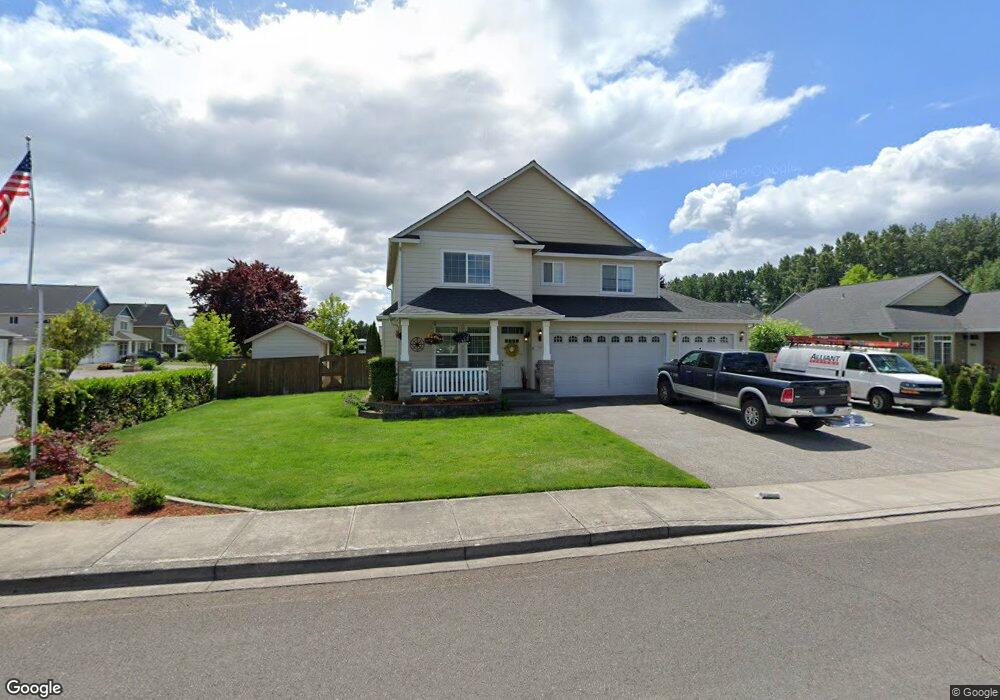
547 Marty Loop Woodland, WA 98674
Estimated Value: $542,277 - $702,000
4
Beds
3
Baths
2,448
Sq Ft
$250/Sq Ft
Est. Value
About This Home
This home is located at 547 Marty Loop, Woodland, WA 98674 and is currently estimated at $612,069, approximately $250 per square foot. 547 Marty Loop is a home located in Cowlitz County with nearby schools including Woodland High School.
Ownership History
Date
Name
Owned For
Owner Type
Purchase Details
Closed on
Mar 19, 2015
Sold by
Hancuff Glenn
Bought by
Mayer Jeremy L and Mayer Jennifer L
Current Estimated Value
Home Financials for this Owner
Home Financials are based on the most recent Mortgage that was taken out on this home.
Original Mortgage
$265,010
Outstanding Balance
$203,494
Interest Rate
3.75%
Mortgage Type
FHA
Estimated Equity
$408,575
Purchase Details
Closed on
Nov 13, 2012
Sold by
Fannie Mae
Bought by
Hancuff Glenn
Home Financials for this Owner
Home Financials are based on the most recent Mortgage that was taken out on this home.
Original Mortgage
$8,444
Interest Rate
3.33%
Mortgage Type
Stand Alone Second
Purchase Details
Closed on
Jun 29, 2005
Sold by
Sun Country Homes Inc
Bought by
Eppard Matthew B and Eppard Jodi L
Home Financials for this Owner
Home Financials are based on the most recent Mortgage that was taken out on this home.
Original Mortgage
$46,044
Interest Rate
5.2%
Mortgage Type
Balloon
Create a Home Valuation Report for This Property
The Home Valuation Report is an in-depth analysis detailing your home's value as well as a comparison with similar homes in the area
Home Values in the Area
Average Home Value in this Area
Purchase History
| Date | Buyer | Sale Price | Title Company |
|---|---|---|---|
| Mayer Jeremy L | $269,900 | Stewart Title | |
| Hancuff Glenn | $215,000 | Chicago Title Insurance Co | |
| Eppard Matthew B | $230,224 | Cowlitz County Title |
Source: Public Records
Mortgage History
| Date | Status | Borrower | Loan Amount |
|---|---|---|---|
| Open | Mayer Jeremy L | $265,010 | |
| Previous Owner | Hancuff Glenn | $8,444 | |
| Previous Owner | Hancuff Glenn | $211,105 | |
| Previous Owner | Eppard Matthew B | $46,044 | |
| Previous Owner | Eppard Matthew B | $184,179 |
Source: Public Records
Tax History Compared to Growth
Tax History
| Year | Tax Paid | Tax Assessment Tax Assessment Total Assessment is a certain percentage of the fair market value that is determined by local assessors to be the total taxable value of land and additions on the property. | Land | Improvement |
|---|---|---|---|---|
| 2024 | $4,994 | $453,220 | $56,980 | $396,240 |
| 2023 | $4,755 | $414,510 | $56,980 | $357,530 |
| 2022 | $4,342 | $429,470 | $56,980 | $372,490 |
| 2021 | $4,740 | $368,090 | $51,800 | $316,290 |
| 2020 | $4,276 | $366,330 | $51,820 | $314,510 |
| 2019 | $3,622 | $330,148 | $51,824 | $278,324 |
| 2018 | $3,928 | $314,390 | $51,820 | $262,570 |
| 2017 | $3,274 | $299,770 | $49,360 | $250,410 |
| 2016 | $3,087 | $257,250 | $45,700 | $211,550 |
| 2015 | $2,496 | $238,650 | $45,700 | $192,950 |
| 2013 | -- | $169,340 | $41,580 | $127,760 |
Source: Public Records
Map
Nearby Homes
- 440 Twin Flower Dr S
- 115 Whalen Loop Rd
- 0 Whalen Rd
- 526 3rd St
- 707 3rd St
- 234 Loves Ave
- 766 Hoffman St
- 600 Cc St
- 229 Cc St
- 442 Washington St
- 1018 Caples Rd
- 0 NW 389th St Unit 257845145
- 0 NW 389th St Unit NWM2280971
- 0 NW 389th St Unit 24366944
- 39806 NW 64th Ct
- 147 Windmill Ln
- 1 NW 389th St
- 1066 S Pekin Rd
- 2825 Dike Rd
- 9565 Old Pacific Hwy