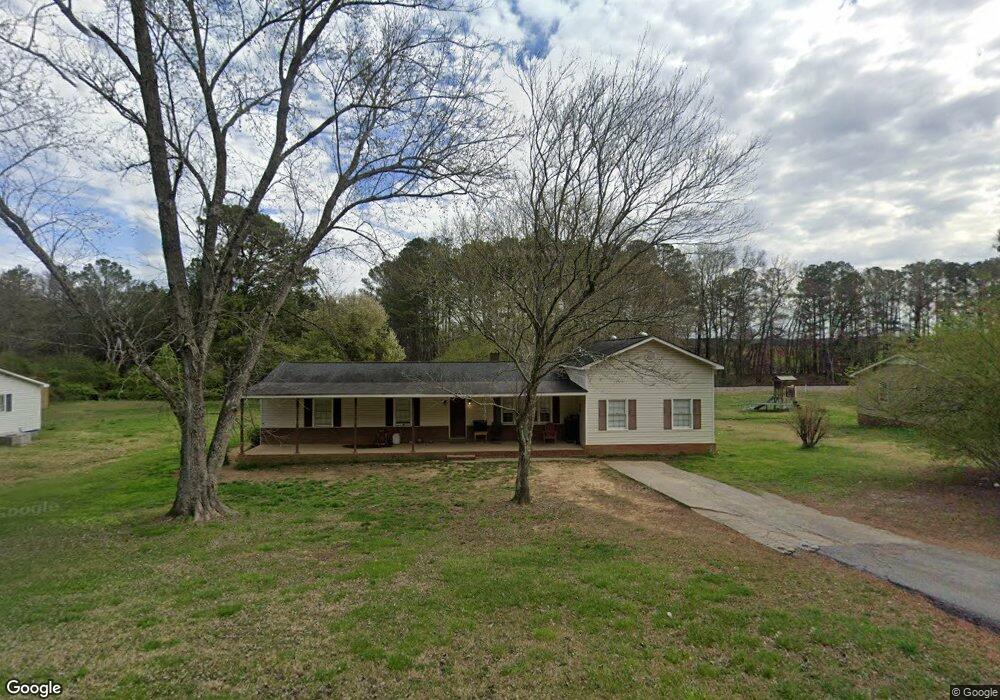
547 Morton Springs Rd Cedartown, GA 30125
Estimated Value: $216,000 - $252,000
4
Beds
3
Baths
1,888
Sq Ft
$127/Sq Ft
Est. Value
About This Home
This home is located at 547 Morton Springs Rd, Cedartown, GA 30125 and is currently estimated at $239,806, approximately $127 per square foot. 547 Morton Springs Rd is a home located in Polk County with nearby schools including Cedar Christian School.
Ownership History
Date
Name
Owned For
Owner Type
Purchase Details
Closed on
Apr 17, 2002
Sold by
Citifinancial Services Inc
Bought by
Blankenship David
Current Estimated Value
Purchase Details
Closed on
Oct 2, 2001
Sold by
Citifinancial Services Inc (Attn) Lisa G
Bought by
Citifinancial Services Inc
Purchase Details
Closed on
May 27, 1993
Sold by
Johnson Lisa Gayle
Bought by
Fulkman Joseph Ray
Purchase Details
Closed on
Aug 15, 1989
Sold by
Johnson Melvin Dougl
Bought by
Johnson Lisa Gayle
Purchase Details
Closed on
Oct 1, 1979
Sold by
Vanvanvanvangoldin Tony Van
Bought by
Johnson Melvin D
Purchase Details
Closed on
Aug 11, 1977
Sold by
Forrister O C
Bought by
Vanvanvanvangoldin Tony Van
Purchase Details
Closed on
Sep 9, 1976
Sold by
Forrister James C
Bought by
Forrister O C
Purchase Details
Closed on
Jan 22, 1976
Sold by
Adkins Alton E
Bought by
Forrister James C
Purchase Details
Closed on
May 17, 1974
Bought by
Adkins Alton E
Create a Home Valuation Report for This Property
The Home Valuation Report is an in-depth analysis detailing your home's value as well as a comparison with similar homes in the area
Home Values in the Area
Average Home Value in this Area
Purchase History
| Date | Buyer | Sale Price | Title Company |
|---|---|---|---|
| Blankenship David | $37,000 | -- | |
| Citifinancial Services Inc | $39,900 | -- | |
| Fulkman Joseph Ray | $31,500 | -- | |
| Johnson Lisa Gayle | -- | -- | |
| Johnson Melvin D | -- | -- | |
| Vanvanvanvangoldin Tony Van | -- | -- | |
| Forrister O C | -- | -- | |
| Forrister James C | -- | -- | |
| Adkins Alton E | -- | -- |
Source: Public Records
Tax History Compared to Growth
Tax History
| Year | Tax Paid | Tax Assessment Tax Assessment Total Assessment is a certain percentage of the fair market value that is determined by local assessors to be the total taxable value of land and additions on the property. | Land | Improvement |
|---|---|---|---|---|
| 2024 | $1,736 | $83,053 | $1,531 | $81,522 |
| 2023 | $1,258 | $53,024 | $1,531 | $51,493 |
| 2022 | $1,068 | $45,007 | $1,021 | $43,986 |
| 2021 | $1,082 | $45,007 | $1,021 | $43,986 |
| 2020 | $1,084 | $45,007 | $1,021 | $43,986 |
| 2019 | $738 | $27,471 | $1,021 | $26,450 |
| 2018 | $734 | $26,642 | $1,021 | $25,621 |
| 2017 | $725 | $26,642 | $1,021 | $25,621 |
| 2016 | $745 | $27,378 | $1,757 | $25,621 |
| 2015 | $752 | $27,543 | $1,757 | $25,786 |
| 2014 | $757 | $27,543 | $1,757 | $25,786 |
Source: Public Records
Map
Nearby Homes
- 00 Antioch Rd
- 766 Antioch Rd
- 95 Wieuca Way
- 000 Wieuca Way
- 0 Wieuca Way Unit 10614129
- 142 Acres On Judkin Mill Rd
- 00 Buchanan Hwy
- 1987 Buchanan Hwy
- 35 Old Mill Rd
- 160 Tate Rd
- 203 Cason Rd
- 497 Judkin Mill Rd
- 117 Cason Rd
- 0 Buchanan Hwy Unit 10558945
- 0 Youngs Farm Rd Unit 24829378
- 205 Pinecrest Rd
- 0 Old Esom Hill Loop Unit 7654342
- 0 Old Esom Hill Loop Unit 10611077
- 1345 Lees Chapel Rd
- 0 Coaling Rd Unit 9221-D 10352096
- 557 Morton Springs Rd
- 535 Morton Springs Rd
- 567 Morton Springs Rd
- 525 Morton Springs Rd
- 577 Morton Springs Rd
- 515 Morton Springs Rd
- 580 Morton Springs Rd
- 587 Morton Springs Rd
- 505 Morton Springs Rd
- 594 Morton Springs Rd
- 597 Morton Springs Rd
- 495 Morton Springs Rd
- 617 Morton Springs Rd
- 471 Morton Springs Rd
- 0 Huntington Rd Unit 7373767
- 0 Huntington Rd Unit 8137191
- 0 Huntington Rd Unit 3220007
- 0 Huntington Rd
- 300 Huntington Rd
- 465 Morton Springs Rd