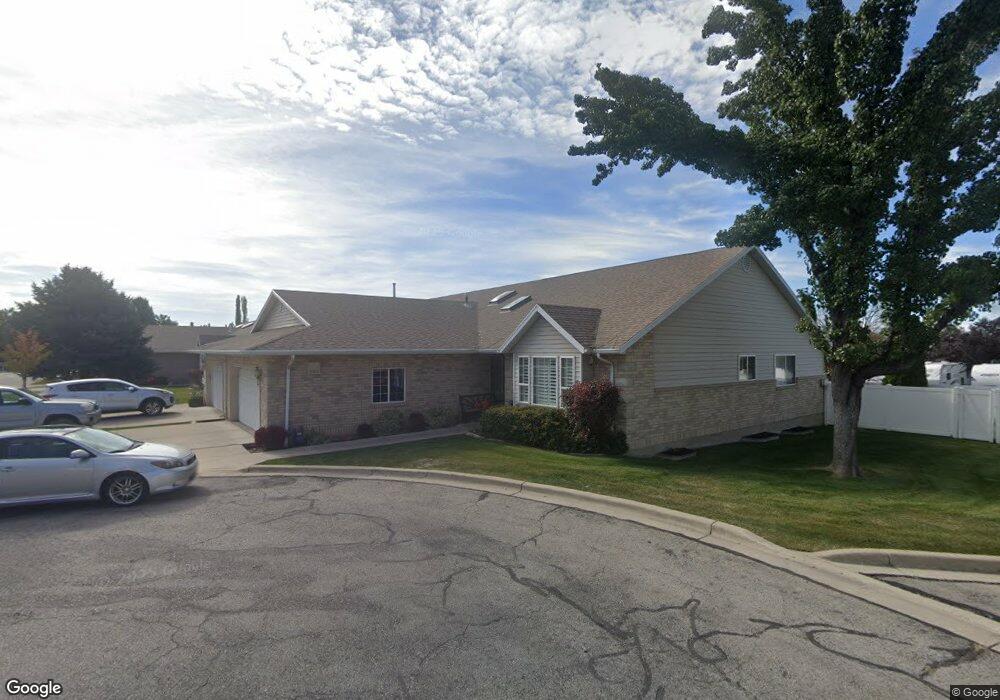
547 N 120 W Lindon, UT 84042
Estimated Value: $578,621 - $602,000
4
Beds
3
Baths
3,920
Sq Ft
$151/Sq Ft
Est. Value
About This Home
This home is located at 547 N 120 W, Lindon, UT 84042 and is currently estimated at $592,155, approximately $151 per square foot. 547 N 120 W is a home located in Utah County with nearby schools including Lindon Elementary School, Oak Canyon Junior High School, and Pleasant Grove High School.
Ownership History
Date
Name
Owned For
Owner Type
Purchase Details
Closed on
Jun 23, 2011
Sold by
Reber Harold L and Reber Mina J
Bought by
Farnsworth David Pearce and Farnsworth Maryruth B
Current Estimated Value
Purchase Details
Closed on
Oct 24, 2005
Sold by
Rigby Charles E and Guyon Sherri L
Bought by
Reber Harold L and Reber Mina J
Purchase Details
Closed on
Mar 24, 2003
Sold by
Rigby Charles E and Rigby Mary Jayne
Bought by
Rigby Charles E and Rigby Mary Jayne
Create a Home Valuation Report for This Property
The Home Valuation Report is an in-depth analysis detailing your home's value as well as a comparison with similar homes in the area
Home Values in the Area
Average Home Value in this Area
Purchase History
| Date | Buyer | Sale Price | Title Company |
|---|---|---|---|
| Farnsworth David Pearce | -- | Access Title Company | |
| Reber Harold L | -- | Bartlett Title Insurance Ag | |
| Rigby Charles E | -- | Sundance Title Insurance Ag | |
| Rigby Charles E | -- | Sundance Title Insurance Ag |
Source: Public Records
Tax History Compared to Growth
Tax History
| Year | Tax Paid | Tax Assessment Tax Assessment Total Assessment is a certain percentage of the fair market value that is determined by local assessors to be the total taxable value of land and additions on the property. | Land | Improvement |
|---|---|---|---|---|
| 2025 | $2,474 | $301,895 | $55,000 | $493,900 |
| 2024 | $2,474 | $304,920 | $0 | $0 |
| 2023 | $2,425 | $321,090 | $0 | $0 |
| 2022 | $2,021 | $258,555 | $0 | $0 |
| 2021 | $1,789 | $345,000 | $41,400 | $303,600 |
| 2020 | $1,817 | $345,000 | $41,400 | $303,600 |
| 2019 | $1,560 | $309,000 | $37,100 | $271,900 |
| 2018 | $1,542 | $288,000 | $34,600 | $253,400 |
| 2017 | $1,582 | $158,400 | $0 | $0 |
| 2016 | $1,568 | $145,200 | $0 | $0 |
| 2015 | $1,658 | $145,200 | $0 | $0 |
| 2014 | $1,515 | $131,450 | $0 | $0 |
Source: Public Records
Map
Nearby Homes