Estimated Value: $126,000 - $189,000
3
Beds
2
Baths
1,410
Sq Ft
$117/Sq Ft
Est. Value
About This Home
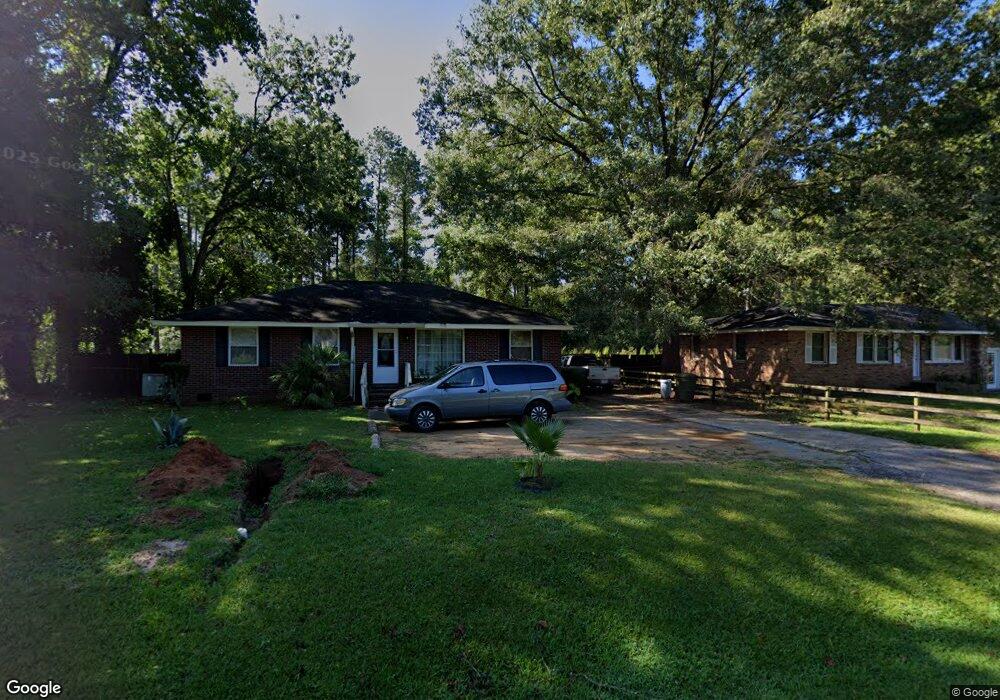
This home is located at 547 New State Rd, Cayce, SC 29033 and is currently estimated at $165,362, approximately $117 per square foot. 547 New State Rd is a home located in Lexington County with nearby schools including Cayce Elementary, Cyril B. Busbee Creative Arts Academy, and Brookland-Cayce High School.
Ownership History
Date
Name
Owned For
Owner Type
Purchase Details
Closed on
Dec 5, 2017
Sold by
Jamellco 4 Llc
Bought by
Pacheco Jose Luis
Current Estimated Value
Home Financials for this Owner
Home Financials are based on the most recent Mortgage that was taken out on this home.
Original Mortgage
$50,000
Outstanding Balance
$23,053
Interest Rate
3.9%
Mortgage Type
New Conventional
Estimated Equity
$142,309
Purchase Details
Closed on
Oct 30, 2014
Sold by
Cain John D O
Bought by
Jamellco 4 Llc
Purchase Details
Closed on
Jun 16, 2006
Sold by
Dlj Mortgage Capital Inc
Bought by
Ocain John D
Home Financials for this Owner
Home Financials are based on the most recent Mortgage that was taken out on this home.
Original Mortgage
$46,000
Interest Rate
6.74%
Mortgage Type
Future Advance Clause Open End Mortgage
Purchase Details
Closed on
Apr 5, 2006
Sold by
Davis William H and Davis Deborah A
Bought by
Dlj Mortgage Capital Inc
Create a Home Valuation Report for This Property
The Home Valuation Report is an in-depth analysis detailing your home's value as well as a comparison with similar homes in the area
Home Values in the Area
Average Home Value in this Area
Purchase History
| Date | Buyer | Sale Price | Title Company |
|---|---|---|---|
| Pacheco Jose Luis | $55,000 | None Available | |
| Jamellco 4 Llc | $45,000 | -- | |
| Ocain John D | $38,000 | None Available | |
| Dlj Mortgage Capital Inc | $47,659 | None Available |
Source: Public Records
Mortgage History
| Date | Status | Borrower | Loan Amount |
|---|---|---|---|
| Open | Pacheco Jose Luis | $50,000 | |
| Previous Owner | Ocain John D | $46,000 |
Source: Public Records
Tax History
| Year | Tax Paid | Tax Assessment Tax Assessment Total Assessment is a certain percentage of the fair market value that is determined by local assessors to be the total taxable value of land and additions on the property. | Land | Improvement |
|---|---|---|---|---|
| 2024 | -- | $2,200 | $400 | $1,800 |
| 2023 | -- | $2,200 | $400 | $1,800 |
| 2022 | $0 | $2,200 | $400 | $1,800 |
| 2020 | $0 | $2,200 | $400 | $1,800 |
| 2019 | $963 | $2,200 | $400 | $1,800 |
| 2018 | $0 | $2,200 | $400 | $1,800 |
| 2017 | $963 | $2,880 | $600 | $2,280 |
| 2016 | $968 | $2,880 | $600 | $2,280 |
| 2014 | $1,022 | $3,541 | $600 | $2,941 |
| 2013 | -- | $3,540 | $600 | $2,940 |
Source: Public Records
Map
Nearby Homes
- 517 Sewanee Ave
- 2703 Riverside Ln
- 2609 Riverland Dr
- 2529 Stonehenge Dr
- 1005 Sunnyside Dr
- 431 Tufton Ct
- 135 Bonhill Dr
- 251 Tufton Ct
- 1137 Allen St
- 411 Rocky Ln
- 2121 Lorick St
- 1314 Northland Dr
- 1001 S Stadium Rd
- 607 Holland Ave
- 707 Holland Ave
- 720 Lexington Ave
- 822 Lexington Ave
- 0 Poplar St Unit Lot 1 598703
- 746 Poplar St
- 750 Poplar St
- 551 New State Rd
- 543 New State Rd
- 539 New State Rd
- 555 New State Rd
- 546 New State Rd
- 550 New State Rd
- 542 New State Rd
- 554 New State Rd
- 538 New State Rd
- 535 New State Rd
- 607 New State Rd
- 534 New State Rd
- 547 Hudson Ave
- 531 New State Rd
- 543 Hudson Ave
- 602 New State Rd
- 605 New State Rd
- 539 Hudson Ave
- 530 New State Rd
- 535 Hudson Ave
Your Personal Tour Guide
Ask me questions while you tour the home.