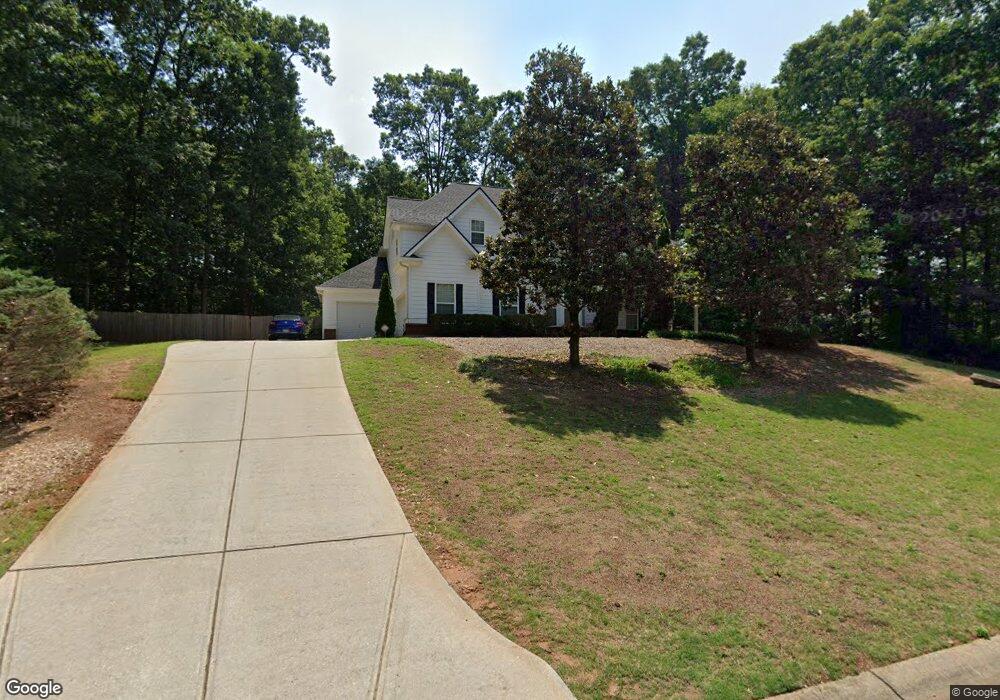
547 Southampton Cir Hoschton, GA 30548
Estimated Value: $499,126 - $704,000
--
Bed
3
Baths
2,989
Sq Ft
$193/Sq Ft
Est. Value
About This Home
This home is located at 547 Southampton Cir, Hoschton, GA 30548 and is currently estimated at $576,532, approximately $192 per square foot. 547 Southampton Cir is a home located in Jackson County with nearby schools including Gum Springs Elementary School, West Jackson Middle School, and Jackson County High School.
Ownership History
Date
Name
Owned For
Owner Type
Purchase Details
Closed on
Oct 7, 2009
Sold by
Lasalle Bank National Asso
Bought by
Holder Ann G
Current Estimated Value
Home Financials for this Owner
Home Financials are based on the most recent Mortgage that was taken out on this home.
Original Mortgage
$174,775
Outstanding Balance
$112,903
Interest Rate
5.03%
Mortgage Type
FHA
Estimated Equity
$463,629
Purchase Details
Closed on
Feb 3, 2009
Sold by
Barnes Shirley
Bought by
Lasalle Bank National Associat
Purchase Details
Closed on
Apr 29, 2005
Sold by
Dream Maker Construction I
Bought by
Barnes Shirley D
Home Financials for this Owner
Home Financials are based on the most recent Mortgage that was taken out on this home.
Original Mortgage
$209,180
Interest Rate
6.54%
Mortgage Type
New Conventional
Purchase Details
Closed on
Oct 4, 2004
Sold by
Liberty Crest Properties Inc
Bought by
Dream Maker Construction Inc
Create a Home Valuation Report for This Property
The Home Valuation Report is an in-depth analysis detailing your home's value as well as a comparison with similar homes in the area
Home Values in the Area
Average Home Value in this Area
Purchase History
| Date | Buyer | Sale Price | Title Company |
|---|---|---|---|
| Holder Ann G | $178,000 | -- | |
| Lasalle Bank National Associat | $170,738 | -- | |
| Barnes Shirley D | $261,475 | -- | |
| Barnes Shirley D | $261,475 | -- | |
| Dream Maker Construction Inc | $135,000 | -- |
Source: Public Records
Mortgage History
| Date | Status | Borrower | Loan Amount |
|---|---|---|---|
| Open | Lasalle Bank National Associat | $174,775 | |
| Previous Owner | Barnes Shirley D | $209,180 | |
| Previous Owner | Barnes Shirley D | $52,295 |
Source: Public Records
Tax History Compared to Growth
Tax History
| Year | Tax Paid | Tax Assessment Tax Assessment Total Assessment is a certain percentage of the fair market value that is determined by local assessors to be the total taxable value of land and additions on the property. | Land | Improvement |
|---|---|---|---|---|
| 2024 | $4,572 | $171,400 | $20,480 | $150,920 |
| 2023 | $4,572 | $155,040 | $20,480 | $134,560 |
| 2022 | $3,917 | $129,400 | $20,480 | $108,920 |
| 2021 | $3,943 | $129,400 | $20,480 | $108,920 |
| 2020 | $3,639 | $109,920 | $20,480 | $89,440 |
| 2019 | $3,691 | $109,920 | $20,480 | $89,440 |
| 2018 | $3,589 | $105,560 | $20,480 | $85,080 |
| 2017 | $3,230 | $94,445 | $20,480 | $73,965 |
| 2016 | $3,244 | $94,445 | $20,480 | $73,965 |
| 2015 | $2,889 | $83,965 | $10,000 | $73,965 |
| 2014 | $2,790 | $82,800 | $10,000 | $72,800 |
| 2013 | -- | $82,800 | $10,000 | $72,800 |
Source: Public Records
Map
Nearby Homes
- 81 Montvale Dr
- 534 Southampton Cir
- 558 Southampton Cir
- 558 Southampton Cir Unit 20
- 499 Southampton Cir
- 23 Montvale Dr
- 117 Montvale Dr
- 510 Southampton Cir
- 582 Southampton Cir
- 52 Montvale Dr
- 486 Southampton Cir
- 608 Southampton Cir
- 455 Southampton Cir
- 76 Montvale Dr
- 455 S Hampton Cir
- 100 Montvale Dr
- 630 Southampton Cir
- 139 Montvale Dr
- 139 Montvale Dr Unit 80
- 28 Montvale Dr Unit 92