Estimated Value: $179,000 - $195,000
2
Beds
2
Baths
1,105
Sq Ft
$169/Sq Ft
Est. Value
About This Home
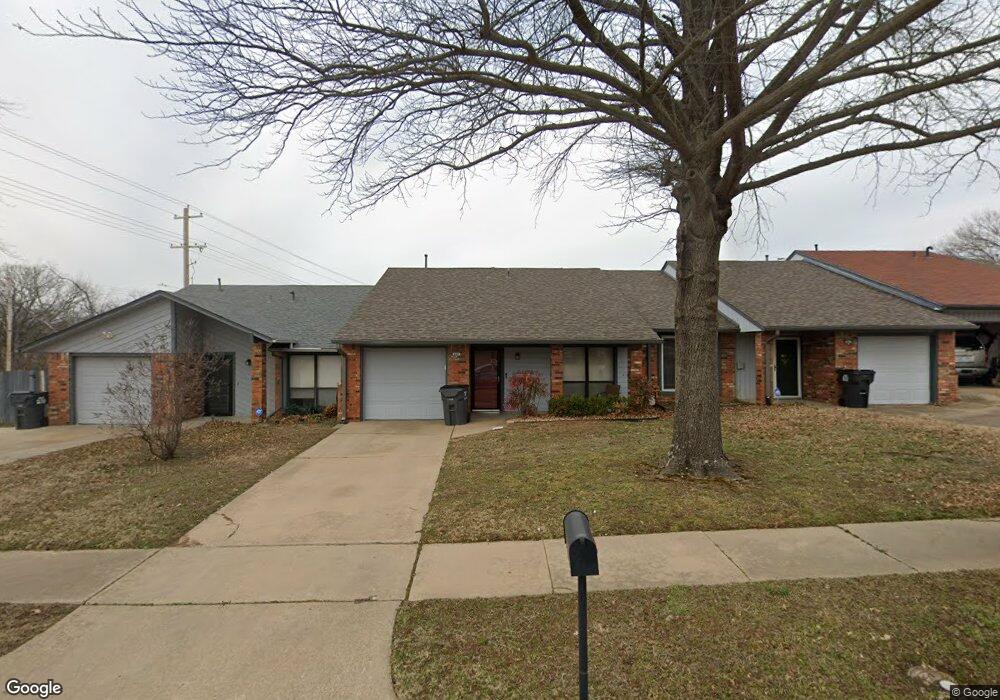
This home is located at 547 W 112th Ct S, Jenks, OK 74037 and is currently estimated at $186,382, approximately $168 per square foot. 547 W 112th Ct S is a home located in Tulsa County with nearby schools including Jenks West Elementary School, Jenks West Intermediate Elementary School, and Jenks Middle School.
Ownership History
Date
Name
Owned For
Owner Type
Purchase Details
Closed on
Feb 27, 2019
Sold by
Lay Billy Mike and Lay Debra Lucile
Bought by
Lei Properties Llc
Current Estimated Value
Purchase Details
Closed on
Mar 25, 2008
Sold by
Matthews Leah J
Bought by
Lay Billy Mike and Lay Debra Lucile
Purchase Details
Closed on
Mar 21, 2005
Sold by
Johnson Tonya D
Bought by
Matthews Leah J
Home Financials for this Owner
Home Financials are based on the most recent Mortgage that was taken out on this home.
Original Mortgage
$74,800
Interest Rate
7.95%
Mortgage Type
Purchase Money Mortgage
Purchase Details
Closed on
Sep 1, 1998
Sold by
Mccracken Mary Elizabeth and Avant Mary Elizabeth
Bought by
Johnson Tonya D
Purchase Details
Closed on
Apr 1, 1994
Create a Home Valuation Report for This Property
The Home Valuation Report is an in-depth analysis detailing your home's value as well as a comparison with similar homes in the area
Home Values in the Area
Average Home Value in this Area
Purchase History
| Date | Buyer | Sale Price | Title Company |
|---|---|---|---|
| Lei Properties Llc | -- | None Available | |
| Lay Billy Mike | $85,000 | None Available | |
| Matthews Leah J | $85,000 | Firstitle & Abstract Service | |
| Johnson Tonya D | $55,000 | Delta Title & Escrow Company | |
| -- | $45,000 | -- |
Source: Public Records
Mortgage History
| Date | Status | Borrower | Loan Amount |
|---|---|---|---|
| Previous Owner | Matthews Leah J | $74,800 |
Source: Public Records
Tax History Compared to Growth
Tax History
| Year | Tax Paid | Tax Assessment Tax Assessment Total Assessment is a certain percentage of the fair market value that is determined by local assessors to be the total taxable value of land and additions on the property. | Land | Improvement |
|---|---|---|---|---|
| 2024 | $1,629 | $13,434 | $1,715 | $11,719 |
| 2023 | $1,629 | $12,795 | $1,760 | $11,035 |
| 2022 | $1,566 | $12,185 | $2,021 | $10,164 |
| 2021 | $1,511 | $11,605 | $1,925 | $9,680 |
| 2020 | $1,478 | $11,605 | $1,925 | $9,680 |
| 2019 | $1,489 | $11,614 | $1,925 | $9,689 |
| 2018 | $1,481 | $11,472 | $1,783 | $9,689 |
| 2017 | $1,413 | $11,128 | $1,730 | $9,398 |
| 2016 | $1,379 | $10,598 | $1,708 | $8,890 |
| 2015 | $1,405 | $10,598 | $1,708 | $8,890 |
| 2014 | $1,398 | $10,598 | $1,708 | $8,890 |
Source: Public Records
Map
Nearby Homes
- 11265 S Fir Ave
- 11261 S Fir Ave
- 682 W 113th Ct S
- 691 W 113th Ct S
- 11264 S Fir Ave
- 11312 S Fir Ave
- 11308 S Fir Ave
- 11224 S Fir Ave
- 11260 S Fir Ave
- 11427 S Ash St
- 11207 S 1st St
- 11304 S 2nd St
- 10821 S Fir St
- 208 E 113th St S
- 10625 S Forest Ave
- 205 E 116th St
- 11220 S Fir Ave
- 11212 S Fir Ave
- 418 E 111th St S
- 187 E 116th St
- 545 W 112th Ct S
- 549 W 112th Ct S
- 549 W 112th Ct S Unit 1
- 543 W 112th Ct S
- 0 W 112th St S Unit 205765
- 0 W 112th St S Unit 221929
- 0 W 112th St S Unit 1003693
- 0 W 112th St S Unit 1024164
- 0 W 112th St S Unit 1103246
- null W 112th East Ave
- 0 W 112th St S Unit 1628181
- 6203 112th Place E
- 6023 112th Place E
- 6011 112th Place E
- 6017 112th Place E
- 541 W 112th Ct S
- 11128 S Date St
- 11126 S Date St
- 6018 112th Place E
- 6012 112th Place E