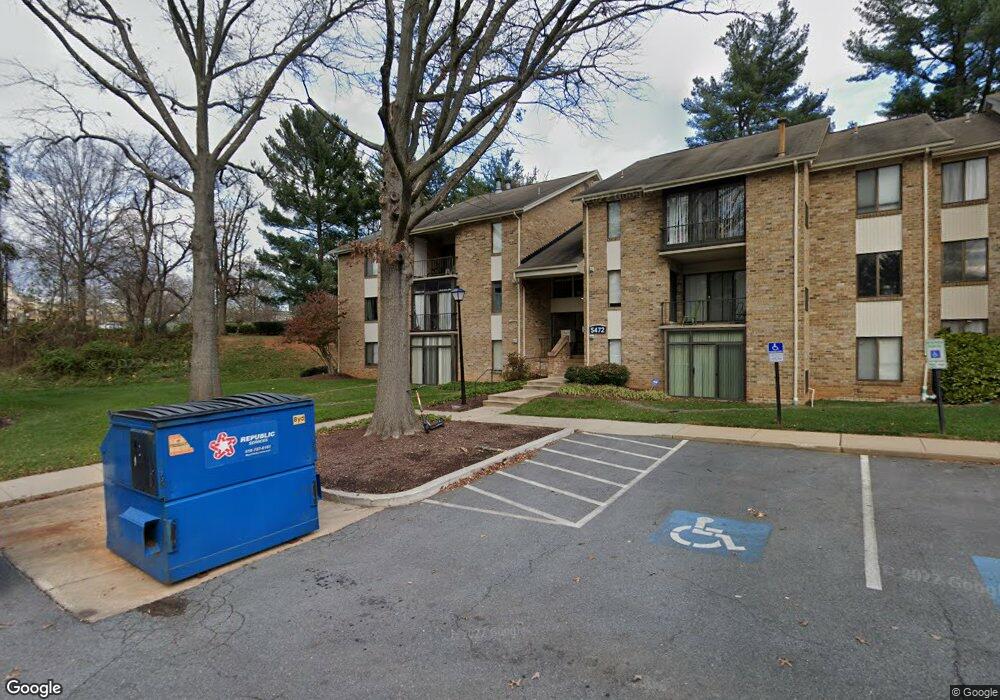
5472 Cedar Ln Unit B1 Columbia, MD 21044
Harper's Choice NeighborhoodEstimated Value: $197,000 - $237,000
2
Beds
2
Baths
935
Sq Ft
$242/Sq Ft
Est. Value
About This Home
This home is located at 5472 Cedar Ln Unit B1, Columbia, MD 21044 and is currently estimated at $226,467, approximately $242 per square foot. 5472 Cedar Ln Unit B1 is a home located in Howard County with nearby schools including Clarksville Elementary School, Harpers Choice Middle School, and Wilde Lake High.
Ownership History
Date
Name
Owned For
Owner Type
Purchase Details
Closed on
Oct 20, 2022
Sold by
Landis Rhonda Q
Bought by
Landis Rhonda Q
Current Estimated Value
Home Financials for this Owner
Home Financials are based on the most recent Mortgage that was taken out on this home.
Original Mortgage
$100,000
Outstanding Balance
$96,650
Interest Rate
6.7%
Mortgage Type
New Conventional
Estimated Equity
$129,817
Purchase Details
Closed on
Jul 28, 2006
Sold by
Belt Rhonda Q
Bought by
Belt Rhonda Q
Purchase Details
Closed on
Jul 5, 2006
Sold by
Belt Rhonda Q
Bought by
Belt Rhonda Q
Purchase Details
Closed on
May 12, 1995
Sold by
Cedar Valley Associates
Bought by
Belt Rhonda Q
Home Financials for this Owner
Home Financials are based on the most recent Mortgage that was taken out on this home.
Original Mortgage
$70,400
Interest Rate
8.31%
Purchase Details
Closed on
Jan 5, 1995
Sold by
Gmg Cedar Valley Lp
Bought by
Cedar Valley Associates
Create a Home Valuation Report for This Property
The Home Valuation Report is an in-depth analysis detailing your home's value as well as a comparison with similar homes in the area
Home Values in the Area
Average Home Value in this Area
Purchase History
| Date | Buyer | Sale Price | Title Company |
|---|---|---|---|
| Landis Rhonda Q | -- | Old Republic Title | |
| Landis Rhonda Q | -- | Old Republic Title | |
| Belt Rhonda Q | -- | -- | |
| Belt Rhonda Q | -- | -- | |
| Belt Rhonda Q | $72,500 | -- | |
| Cedar Valley Associates | $240,740 | -- |
Source: Public Records
Mortgage History
| Date | Status | Borrower | Loan Amount |
|---|---|---|---|
| Open | Landis Rhonda Q | $100,000 | |
| Closed | Landis Rhonda Q | $100,000 | |
| Previous Owner | Cedar Valley Associates | $70,400 |
Source: Public Records
Tax History Compared to Growth
Tax History
| Year | Tax Paid | Tax Assessment Tax Assessment Total Assessment is a certain percentage of the fair market value that is determined by local assessors to be the total taxable value of land and additions on the property. | Land | Improvement |
|---|---|---|---|---|
| 2025 | $2,688 | $176,667 | $0 | $0 |
| 2024 | $2,688 | $166,400 | $49,900 | $116,500 |
| 2023 | $2,524 | $156,100 | $0 | $0 |
| 2022 | $2,376 | $145,800 | $0 | $0 |
| 2021 | $2,240 | $135,500 | $40,600 | $94,900 |
| 2020 | $2,219 | $131,000 | $0 | $0 |
| 2019 | $2,148 | $126,500 | $0 | $0 |
| 2018 | $1,911 | $122,000 | $30,500 | $91,500 |
| 2017 | $1,367 | $122,000 | $0 | $0 |
| 2016 | $339 | $122,000 | $0 | $0 |
| 2015 | $339 | $122,000 | $0 | $0 |
| 2014 | $330 | $122,000 | $0 | $0 |
Source: Public Records
Map
Nearby Homes
- 5472 Cedar Ln Unit A4
- 5472 Cedar Ln Unit C1
- 5475 El Camino
- 5457 El Camino
- 5412 Bucksaw Ct
- 5517 Woodenhawk Cir
- 5531 Woodenhawk Cir
- 11129 Wood Elves Way
- 10901 Swansfield Rd
- 10968 Swansfield Rd
- 10958 Swansfield Rd
- 5443 Hildebrand Ct
- 5633 Gulfstream Row
- 5161 Harpers Farm Rd
- 5451 Fallriver Row Ct
- 5661 Harpers Farm Rd Unit F
- 11238 Crystal Run Unit A
- 10566 Twin Rivers Rd Unit F1
- 10572 Twin Rivers Rd Unit D1
- 10551 Twin Rivers Rd Unit B2
- 5476 Cedar Ln
- 5470 Cedar Ln Unit C1
- 5488 Cedar Ln Unit C1
- 5490 Cedar Ln Unit B2
- 5472 Cedar Ln Unit C3
- 5484 Cedar Ln Unit C2
- 5472 Cedar Ln Unit LNC2
- 5472 Cedar Ln Unit A3
- 5482 Cedar Ln Unit A2
- 5482 Cedar Ln Unit B2
- 5476 Cedar Ln Unit B2
- 5470 Cedar Ln Unit A1
- 5478 Cedar Ln Unit C3
- 5478 Cedar Ln Unit B2
- 5490 Cedar Ln Unit C4
- 5478 Cedar Ln Unit C1
- 5476 Cedar Ln Unit B1
- 5490 Cedar Ln Unit A3
- 5478 Cedar Ln Unit A3
- 5482 Cedar Ln Unit B3