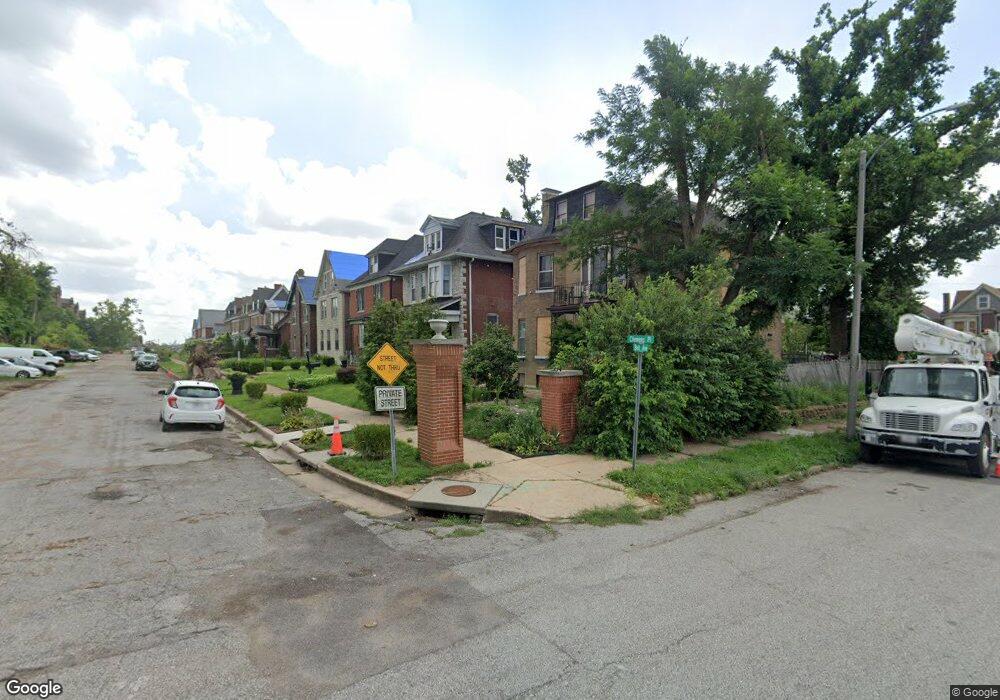
5474 Clemens Place Saint Louis, MO 63112
Visitation Park NeighborhoodEstimated Value: $151,192 - $260,000
5
Beds
2
Baths
2,353
Sq Ft
$91/Sq Ft
Est. Value
About This Home
This home is located at 5474 Clemens Place, Saint Louis, MO 63112 and is currently estimated at $215,298, approximately $91 per square foot. 5474 Clemens Place is a home located in St. Louis City with nearby schools including Sumner High School, KIPP Victory Academy, and KIPP Triumph Academy.
Ownership History
Date
Name
Owned For
Owner Type
Purchase Details
Closed on
Aug 15, 2006
Sold by
Patton Elise C and Johnson Larry
Bought by
Johnson Larry and Patton Elise C
Current Estimated Value
Home Financials for this Owner
Home Financials are based on the most recent Mortgage that was taken out on this home.
Original Mortgage
$109,000
Outstanding Balance
$70,132
Interest Rate
8.12%
Mortgage Type
Stand Alone Refi Refinance Of Original Loan
Estimated Equity
$145,166
Purchase Details
Closed on
Aug 31, 2005
Sold by
Patton Elise C
Bought by
Patton Elise C and Johnson Larry
Home Financials for this Owner
Home Financials are based on the most recent Mortgage that was taken out on this home.
Original Mortgage
$85,500
Interest Rate
6.1%
Mortgage Type
Stand Alone Refi Refinance Of Original Loan
Purchase Details
Closed on
Apr 28, 2005
Sold by
Patton Elise C and Patton Manuel Elsie S
Bought by
Patton Elise C
Purchase Details
Closed on
Oct 22, 1998
Sold by
Patton Darryle M and Patton Patricia A
Bought by
Patton Dollestor M
Create a Home Valuation Report for This Property
The Home Valuation Report is an in-depth analysis detailing your home's value as well as a comparison with similar homes in the area
Home Values in the Area
Average Home Value in this Area
Purchase History
| Date | Buyer | Sale Price | Title Company |
|---|---|---|---|
| Johnson Larry | -- | Integrity Land Title Co Inc | |
| Patton Elise C | -- | Richmond Title Services | |
| Patton Elise C | -- | -- | |
| Patton Elise C | -- | -- | |
| Patton Dollestor M | -- | -- |
Source: Public Records
Mortgage History
| Date | Status | Borrower | Loan Amount |
|---|---|---|---|
| Open | Johnson Larry | $109,000 | |
| Closed | Patton Elise C | $85,500 |
Source: Public Records
Tax History Compared to Growth
Tax History
| Year | Tax Paid | Tax Assessment Tax Assessment Total Assessment is a certain percentage of the fair market value that is determined by local assessors to be the total taxable value of land and additions on the property. | Land | Improvement |
|---|---|---|---|---|
| 2025 | $585 | $7,100 | $1,100 | $6,000 |
| 2024 | $557 | $6,650 | $1,100 | $5,550 |
| 2023 | $557 | $6,650 | $1,100 | $5,550 |
| 2022 | $560 | $6,440 | $1,100 | $5,340 |
| 2021 | $560 | $6,440 | $1,100 | $5,340 |
| 2020 | $555 | $6,440 | $1,100 | $5,340 |
| 2019 | $554 | $6,440 | $1,100 | $5,340 |
| 2018 | $547 | $6,150 | $1,100 | $5,050 |
| 2017 | $538 | $6,160 | $1,100 | $5,050 |
| 2016 | $544 | $6,160 | $1,100 | $5,050 |
| 2015 | $496 | $6,150 | $1,100 | $5,050 |
| 2014 | $482 | $6,150 | $1,100 | $5,050 |
| 2013 | -- | $5,980 | $1,100 | $4,880 |
Source: Public Records
Map
Nearby Homes
- 5461 Enright Ave
- 5531 Clemens Ave
- 5350 Cabanne Ave
- 627 Clara Ave Unit 1B
- 5315 Cabanne Ave
- 5233 Cates Ave
- 85 Waterman Place
- 5501 Waterman Blvd Unit B
- 5715 Enright Ave
- 5567 Waterman Blvd Unit B
- 5710 Maple Ave
- 5720 Cates Ave
- 5300 Maple Ave
- 5696 Kingsbury Ave Unit 102
- 5696 Kingsbury Ave Unit 306
- 5696 Kingsbury Ave Unit 406
- 5541 Chamberlain Ave
- 5673 Waterman Blvd Unit 31
- 5683 Waterman Blvd Unit 2W
- 5800 Clemens Ave
- 5470 Clemens Place
- 5478 Clemens Place
- 5466 Clemens Place
- 5458 Clemens Place
- 5473 Enright Ave
- 5477 Enright Ave
- 5479 Enright Ave
- 5465 Enright Ave
- 5452 Clemens Place
- 5450 Clemens Place
- 5457 Enright Ave
- 5453 Enright Ave
- 5448 Clemens Place
- 5509 Clemens Place
- 5449 Enright Ave
- 5444 Clemens Place
- 5511 Clemens Place
- 5447 Enright Ave
- 5440 Clemens Place