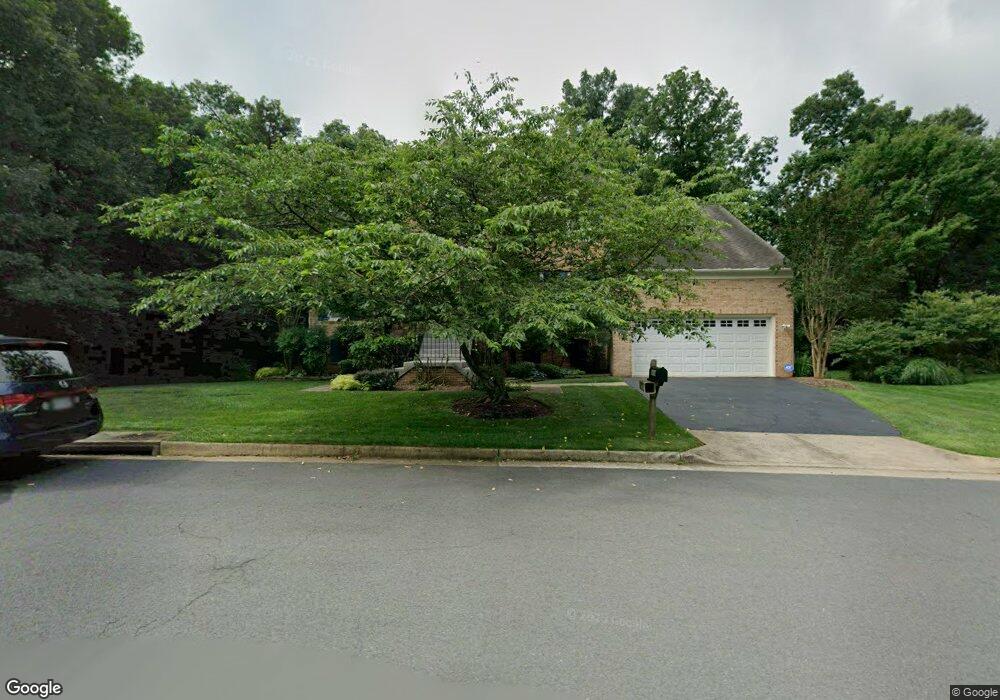
5474 Rockpointe Dr Clifton, VA 20124
Estimated Value: $1,046,000 - $1,130,000
5
Beds
4
Baths
2,913
Sq Ft
$368/Sq Ft
Est. Value
About This Home
This home is located at 5474 Rockpointe Dr, Clifton, VA 20124 and is currently estimated at $1,071,954, approximately $367 per square foot. 5474 Rockpointe Dr is a home located in Fairfax County with nearby schools including Willow Springs Elementary School, Johnson Middle School, and Fairfax High.
Ownership History
Date
Name
Owned For
Owner Type
Purchase Details
Closed on
Mar 27, 2003
Sold by
Daugherty Ricky J
Bought by
Howard Joanne F
Current Estimated Value
Home Financials for this Owner
Home Financials are based on the most recent Mortgage that was taken out on this home.
Original Mortgage
$412,800
Outstanding Balance
$179,418
Interest Rate
5.91%
Mortgage Type
New Conventional
Estimated Equity
$892,536
Purchase Details
Closed on
Jun 8, 2000
Sold by
Sugrue Timothy F
Bought by
Daugherty Ricky
Home Financials for this Owner
Home Financials are based on the most recent Mortgage that was taken out on this home.
Original Mortgage
$378,000
Interest Rate
8.12%
Purchase Details
Closed on
Aug 18, 1994
Sold by
J Laing Homes
Bought by
Sugrue Timothy F
Home Financials for this Owner
Home Financials are based on the most recent Mortgage that was taken out on this home.
Original Mortgage
$297,000
Interest Rate
8.61%
Create a Home Valuation Report for This Property
The Home Valuation Report is an in-depth analysis detailing your home's value as well as a comparison with similar homes in the area
Home Values in the Area
Average Home Value in this Area
Purchase History
| Date | Buyer | Sale Price | Title Company |
|---|---|---|---|
| Howard Joanne F | $516,000 | -- | |
| Daugherty Ricky | $420,000 | -- | |
| Sugrue Timothy F | $330,000 | -- |
Source: Public Records
Mortgage History
| Date | Status | Borrower | Loan Amount |
|---|---|---|---|
| Open | Sugrue Timothy F | $412,800 | |
| Previous Owner | Daugherty Ricky | $378,000 | |
| Previous Owner | Sugrue Timothy F | $297,000 |
Source: Public Records
Tax History
| Year | Tax Paid | Tax Assessment Tax Assessment Total Assessment is a certain percentage of the fair market value that is determined by local assessors to be the total taxable value of land and additions on the property. | Land | Improvement |
|---|---|---|---|---|
| 2025 | -- | $984,900 | $352,000 | $632,900 |
| 2024 | $10,853 | $936,800 | $332,000 | $604,800 |
| 2023 | $10,258 | $936,800 | $332,000 | $604,800 |
| 2022 | $9,341 | $816,860 | $312,000 | $504,860 |
| 2021 | $0 | $731,100 | $267,000 | $464,100 |
| 2020 | $8,512 | $719,190 | $267,000 | $452,190 |
| 2019 | $8,250 | $697,090 | $267,000 | $430,090 |
| 2018 | $7,923 | $688,970 | $267,000 | $421,970 |
| 2017 | $7,752 | $667,660 | $252,000 | $415,660 |
| 2016 | $7,735 | $667,660 | $252,000 | $415,660 |
Source: Public Records
Map
Nearby Homes
- 13052 Harvest Place
- 13038 Limestone Ct
- 5401 Willow Forest Ct
- 5717 Old Clifton Rd
- 13258 Maple Creek Ln
- 13346 Regal Crest Dr
- 5105 Whisper Willow Dr
- 5613 Gosling Dr
- 5724 Osprey Ct
- 5156 Summit Dr
- 5408 Heatherford Ct
- 5012 Whisper Willow Dr
- 13511 Orchard Dr Unit 3511
- 5309 Granite Step Trail
- 13572 Jasper Ln
- 5002 Cool Fountain Ln
- 5820 Orchard Hill Ct Unit 5820
- 5815 Orchard Hill Ct Unit 5815
- 12609 Braddock Rd
- 4904 Elsa Ct
- 5472 Rockpointe Dr
- 13057 Harvest Place
- 13055 Harvest Place
- 5473 Rockpointe Dr
- 13053 Harvest Place
- 5470 Rockpointe Dr
- 5475 Rockpointe Dr
- 13051 Harvest Place
- 13049 Harvest Place
- 13047 Harvest Place
- 13101 Rockpointe Ct
- 5477 Rockpointe Dr
- 13103 Rockpointe Ct
- 5469 Rockpointe Dr
- 13045 Harvest Place
- 5479 Rockpointe Dr
- 13043 Harvest Place
- 13105 Rockpointe Ct
- 13041 Harvest Place
- 13056 Harvest Place
Your Personal Tour Guide
Ask me questions while you tour the home.