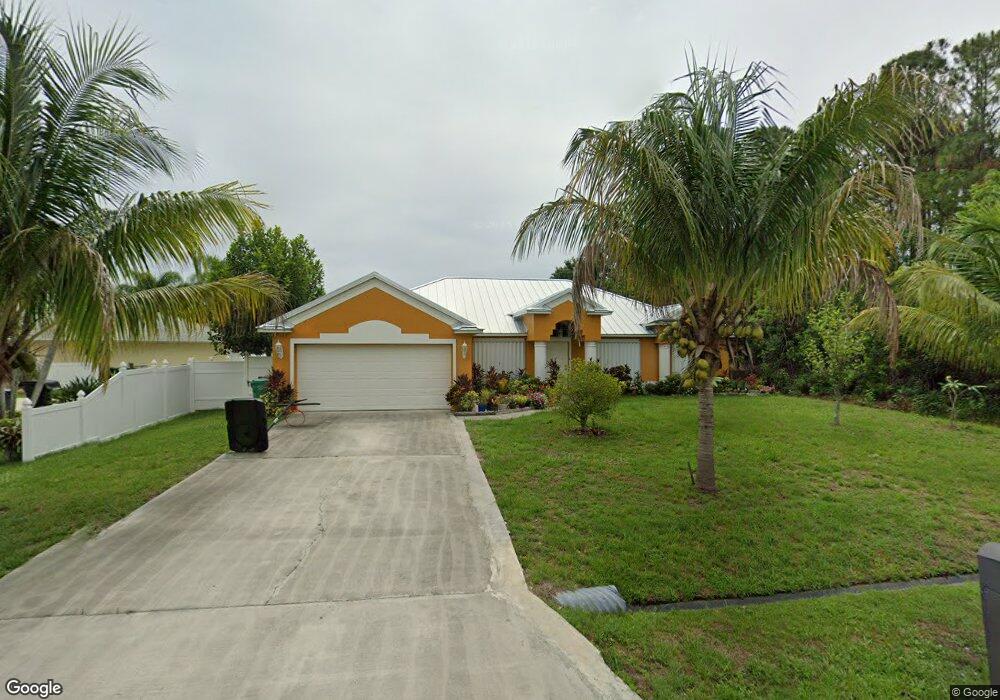
5475 NW Ligon Cir Port Saint Lucie, FL 34983
Saint Lucie North NeighborhoodEstimated Value: $383,632 - $467,000
3
Beds
2
Baths
2,006
Sq Ft
$214/Sq Ft
Est. Value
About This Home
This home is located at 5475 NW Ligon Cir, Port Saint Lucie, FL 34983 and is currently estimated at $428,408, approximately $213 per square foot. 5475 NW Ligon Cir is a home located in St. Lucie County with nearby schools including Parkway Elementary School, Northport K-8 School, and Floresta Elementary School.
Ownership History
Date
Name
Owned For
Owner Type
Purchase Details
Closed on
Dec 14, 2020
Sold by
Hal Mohammed Abdul and Hal Jahanara
Bought by
Hal Mohammed Abdul and Hal Jahanara
Current Estimated Value
Purchase Details
Closed on
Sep 30, 2004
Sold by
Johnson Jimita
Bought by
Hai Mohammed Abdul and Hai Jahanara
Home Financials for this Owner
Home Financials are based on the most recent Mortgage that was taken out on this home.
Original Mortgage
$175,120
Interest Rate
5.73%
Mortgage Type
Purchase Money Mortgage
Purchase Details
Closed on
Sep 26, 2002
Sold by
Merecedes Homes Inc
Bought by
Johnson Jimita
Home Financials for this Owner
Home Financials are based on the most recent Mortgage that was taken out on this home.
Original Mortgage
$125,314
Interest Rate
6.19%
Purchase Details
Closed on
Dec 31, 2001
Sold by
Midway Commerce Cntr Ltd
Bought by
Mercedes Homes Inc
Create a Home Valuation Report for This Property
The Home Valuation Report is an in-depth analysis detailing your home's value as well as a comparison with similar homes in the area
Home Values in the Area
Average Home Value in this Area
Purchase History
| Date | Buyer | Sale Price | Title Company |
|---|---|---|---|
| Hal Mohammed Abdul | -- | Accommodation | |
| Hai Mohammed Abdul | $100 | York Caroline | |
| Hai Mohammed Abdul | $218,900 | Superior Title Services Inc | |
| Johnson Jimita | $132,000 | -- | |
| Mercedes Homes Inc | $9,000 | -- |
Source: Public Records
Mortgage History
| Date | Status | Borrower | Loan Amount |
|---|---|---|---|
| Previous Owner | Hai Mohammed Abdul | $175,120 | |
| Previous Owner | Johnson Jimita | $125,314 |
Source: Public Records
Tax History Compared to Growth
Tax History
| Year | Tax Paid | Tax Assessment Tax Assessment Total Assessment is a certain percentage of the fair market value that is determined by local assessors to be the total taxable value of land and additions on the property. | Land | Improvement |
|---|---|---|---|---|
| 2024 | $2,408 | $125,661 | -- | -- |
| 2023 | $2,408 | $122,001 | $0 | $0 |
| 2022 | $2,284 | $118,448 | $0 | $0 |
| 2021 | $2,185 | $114,999 | $0 | $0 |
| 2020 | $2,187 | $113,412 | $0 | $0 |
| 2019 | $2,157 | $110,863 | $0 | $0 |
| 2018 | $2,040 | $108,796 | $0 | $0 |
| 2017 | $2,011 | $164,200 | $31,600 | $132,600 |
| 2016 | $1,976 | $151,100 | $29,300 | $121,800 |
| 2015 | $1,992 | $121,100 | $20,300 | $100,800 |
| 2014 | $1,898 | $102,820 | $0 | $0 |
Source: Public Records
Map
Nearby Homes
- 6209 NW Duke Cir
- 5515 NW Dunn Rd
- 5303 NW Nassau Ln
- 436 NW Dover Ct
- 6575 NW Pomona Ct
- 6565 NW Pomona Ct
- 430 NW Dover Ct
- 415 NW Dover Ct
- 6305 NW Hala Ct
- 411 NW Dover Ct
- 422 NW Dover Ct
- 5180 NW Newark Ln
- 5423 NW Milner Dr
- 5109 NW Rugby Dr
- 6244 NW Helmsdale Way
- 305 NW Sheffield Cir
- 6145 NW Helmsdale Way
- 6099 NW Helmsdale Way
- 6179 NW Helmsdale Way
- 6413 NW Regal Cir
- 5465 NW Ligon Cir
- 5445 NW Dunn Rd
- 5455 NW Dunn Rd
- 5495 NW Ligon Cir
- 5490 NW Ligon Cir
- 5435 NW Dunn Rd
- 5480 NW Ligon Cir
- 5470 NW Ligon Cir
- 5465 NW Dunn Rd
- 6205 NW Nw Lybia Ln
- 5515 NW Ligon Cir
- 5475 NW Dunn Rd
- 5450 NW Dunn Rd
- 6215 NW Odate Ct
- 6230 NW Odate Ct
- 5485 NW Dunn Rd
- 5500 NW Ligon Cir
- 5525 NW Ligon Cir
- 5430 NW Ligon Cir
- 5430 NW Dunn Rd