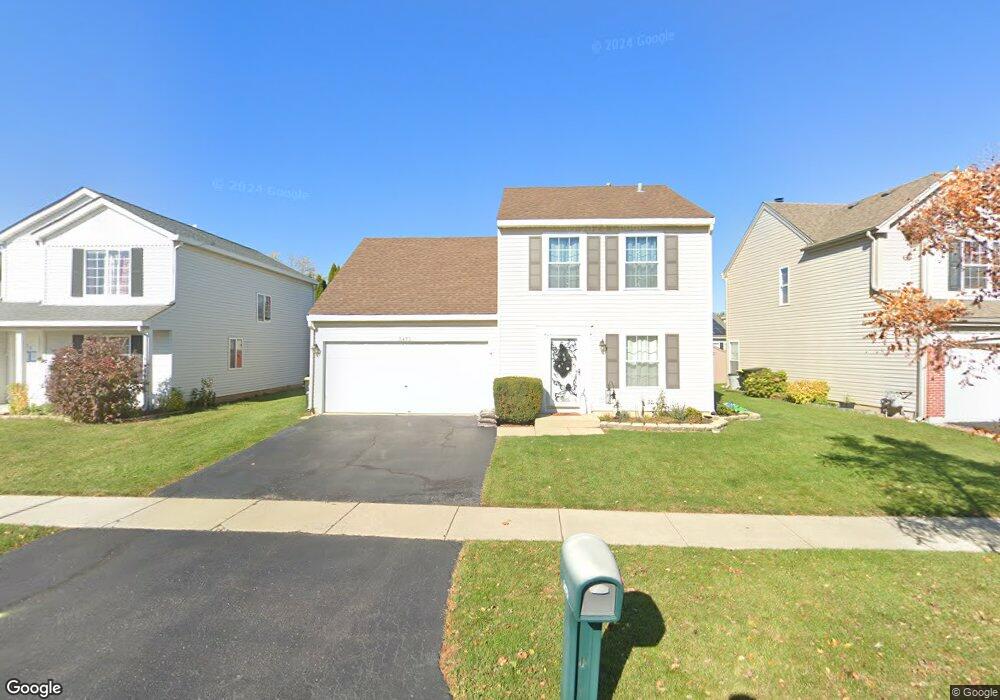
5475 Whitmore Way Lake In the Hills, IL 60156
Estimated Value: $312,784 - $349,000
--
Bed
--
Bath
1,616
Sq Ft
$207/Sq Ft
Est. Value
About This Home
This home is located at 5475 Whitmore Way, Lake In the Hills, IL 60156 and is currently estimated at $334,196, approximately $206 per square foot. 5475 Whitmore Way is a home located in McHenry County with nearby schools including Mackeben Elementary School, Conley Elementary School, and Heineman Middle School.
Ownership History
Date
Name
Owned For
Owner Type
Purchase Details
Closed on
Dec 29, 2008
Sold by
Bellchase Homeowners Association Inc
Bought by
Mabry James and Mabry Stella
Current Estimated Value
Purchase Details
Closed on
Jul 11, 2001
Sold by
Seibert Chad A and Seibert Nicola S
Bought by
Mabry James and Mabry Stella
Home Financials for this Owner
Home Financials are based on the most recent Mortgage that was taken out on this home.
Original Mortgage
$171,870
Interest Rate
7.27%
Mortgage Type
VA
Purchase Details
Closed on
Sep 9, 1996
Sold by
Sar Development Inc
Bought by
Seibert Chad A and Seibert Nicola S
Home Financials for this Owner
Home Financials are based on the most recent Mortgage that was taken out on this home.
Original Mortgage
$103,700
Interest Rate
7.87%
Create a Home Valuation Report for This Property
The Home Valuation Report is an in-depth analysis detailing your home's value as well as a comparison with similar homes in the area
Home Values in the Area
Average Home Value in this Area
Purchase History
| Date | Buyer | Sale Price | Title Company |
|---|---|---|---|
| Mabry James | -- | Chicago Title Insurance Co | |
| Mabry James | $168,500 | -- | |
| Seibert Chad A | $130,000 | -- |
Source: Public Records
Mortgage History
| Date | Status | Borrower | Loan Amount |
|---|---|---|---|
| Previous Owner | Mabry James | $171,870 | |
| Previous Owner | Seibert Chad A | $103,700 | |
| Closed | Seibert Chad A | $12,950 |
Source: Public Records
Tax History Compared to Growth
Tax History
| Year | Tax Paid | Tax Assessment Tax Assessment Total Assessment is a certain percentage of the fair market value that is determined by local assessors to be the total taxable value of land and additions on the property. | Land | Improvement |
|---|---|---|---|---|
| 2024 | -- | $91,020 | $6,989 | $84,031 |
| 2023 | $5,743 | $81,764 | $6,278 | $75,486 |
| 2022 | $5,743 | $74,453 | $5,717 | $68,736 |
| 2021 | $5,558 | $70,119 | $5,384 | $64,735 |
| 2020 | $5,480 | $68,249 | $5,240 | $63,009 |
| 2019 | $5,391 | $66,506 | $5,106 | $61,400 |
| 2018 | $5,096 | $61,987 | $5,747 | $56,240 |
| 2017 | $4,989 | $58,418 | $5,416 | $53,002 |
| 2016 | $5,024 | $55,541 | $5,149 | $50,392 |
| 2013 | -- | $47,822 | $6,645 | $41,177 |
Source: Public Records
Map
Nearby Homes
- 131 S Annandale Dr
- 390 Windermere Way
- 10828 Braemar Pkwy
- 10967 Braemar Pkwy
- 11290 Wildridge Ln
- 9946 Edgebrook Ln
- 11291 Wildridge Ln
- 9966 Edgebrook Ln
- 9956 Edgebrook Ln
- 9976 Edgebrook Ln
- 11300 Wildridge Ln
- 11310 Wildridge Ln
- 9927 Edgebrook Ln
- 9937 Edgebrook Ln
- 9957 Edgebrook Ln
- 11320 Wildridge Ln
- 9947 Edgebrook Ln
- 9967 Edgebrook Ln
- 11331 Wildridge Ln
- 11351 Wildridge Ln
- 5473 Whitmore Way
- 5477 Whitmore Way
- 5479 Whitmore Way
- 5471 Whitmore Way
- 8 Annandale Ct
- 6 Annandale Ct
- 5474 Whitmore Way
- 4 Annandale Ct
- 5472 Whitmore Way
- 5476 Whitmore Way
- 5481 Whitmore Way
- 5469 Whitmore Way
- 141 Bridlewood Cir
- 5478 Whitmore Way
- 151 Bridlewood Cir
- 2 Annandale Ct
- 5480 Whitmore Way Unit 2
- 5467 Whitmore Way Unit 2
- 11 Annandale Ct
- 5465 Whitmore Way