Estimated Value: $176,000 - $198,000
3
Beds
2
Baths
960
Sq Ft
$191/Sq Ft
Est. Value
About This Home
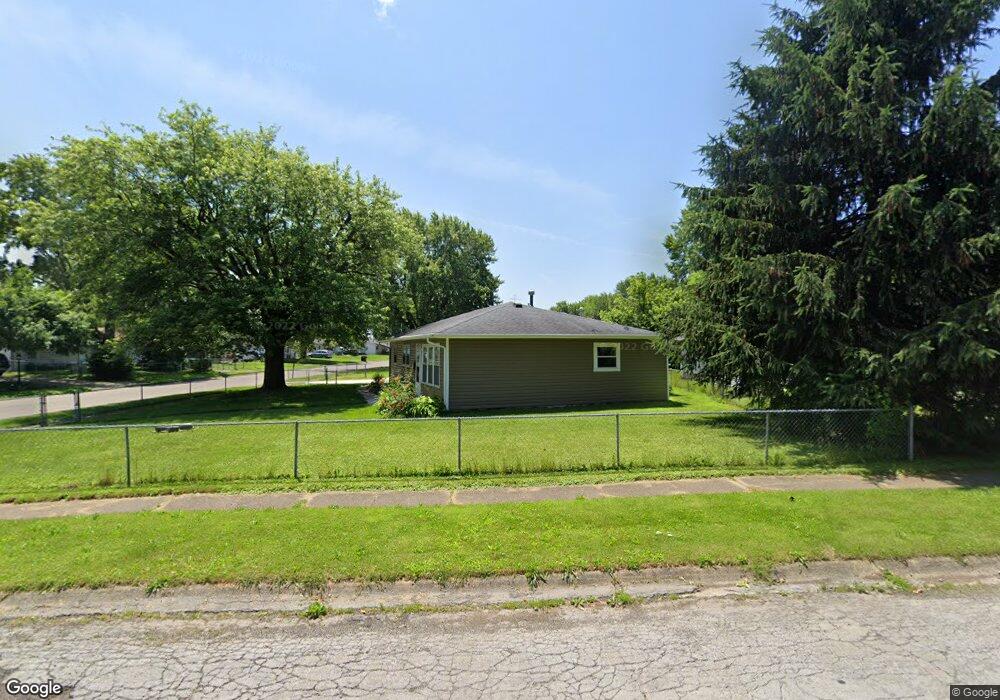
This home is located at 548 Antrim Rd, Xenia, OH 45385 and is currently estimated at $183,537, approximately $191 per square foot. 548 Antrim Rd is a home located in Greene County with nearby schools including Xenia High School, Summit Academy Community School for Alternative Learners - Xenia, and Legacy Christian Academy.
Ownership History
Date
Name
Owned For
Owner Type
Purchase Details
Closed on
Feb 6, 2024
Sold by
Wallman Justin and Wallman Sarah
Bought by
Advantage Rental Properties Llc
Current Estimated Value
Purchase Details
Closed on
Mar 24, 2021
Sold by
Hiney Glenn E
Bought by
Wallman Justin
Home Financials for this Owner
Home Financials are based on the most recent Mortgage that was taken out on this home.
Original Mortgage
$99,675
Interest Rate
2.8%
Mortgage Type
Future Advance Clause Open End Mortgage
Purchase Details
Closed on
Jan 18, 2019
Sold by
Matson Magel R and Day Debra
Bought by
Hiney Glenn E
Create a Home Valuation Report for This Property
The Home Valuation Report is an in-depth analysis detailing your home's value as well as a comparison with similar homes in the area
Home Values in the Area
Average Home Value in this Area
Purchase History
| Date | Buyer | Sale Price | Title Company |
|---|---|---|---|
| Advantage Rental Properties Llc | -- | None Listed On Document | |
| Wallman Justin | $132,900 | None Available | |
| Hiney Glenn E | $69,900 | None Available |
Source: Public Records
Mortgage History
| Date | Status | Borrower | Loan Amount |
|---|---|---|---|
| Previous Owner | Wallman Justin | $99,675 |
Source: Public Records
Tax History Compared to Growth
Tax History
| Year | Tax Paid | Tax Assessment Tax Assessment Total Assessment is a certain percentage of the fair market value that is determined by local assessors to be the total taxable value of land and additions on the property. | Land | Improvement |
|---|---|---|---|---|
| 2024 | $2,080 | $48,620 | $10,160 | $38,460 |
| 2023 | $2,080 | $48,620 | $10,160 | $38,460 |
| 2022 | $1,729 | $34,470 | $7,260 | $27,210 |
| 2021 | $1,448 | $29,210 | $7,260 | $21,950 |
| 2020 | $1,386 | $29,210 | $7,260 | $21,950 |
| 2019 | $692 | $22,480 | $5,040 | $17,440 |
| 2018 | $695 | $22,480 | $5,040 | $17,440 |
| 2017 | $638 | $22,480 | $5,040 | $17,440 |
| 2016 | $639 | $21,150 | $5,040 | $16,110 |
| 2015 | $270 | $21,150 | $5,040 | $16,110 |
| 2014 | -- | $21,150 | $5,040 | $16,110 |
Source: Public Records
Map
Nearby Homes
- 509 Antrim Rd
- 883 Omard Dr
- 912 Omard Dr
- 343 Sheelin Rd
- 613 N West St
- 1351 Omard Dr
- 516 N King St
- 137 Pleasant St
- 659 N King St
- 1233 June Dr
- 1283 June Dr
- 1430 Reid Ave
- 878 N Detroit St
- 902 N Detroit St
- 1391 June Dr
- 305-325 Bellbrook Ave
- 1342 Kylemore Dr
- 119 Park Dr
- 1038 Frederick Dr
- 1171 N Detroit St