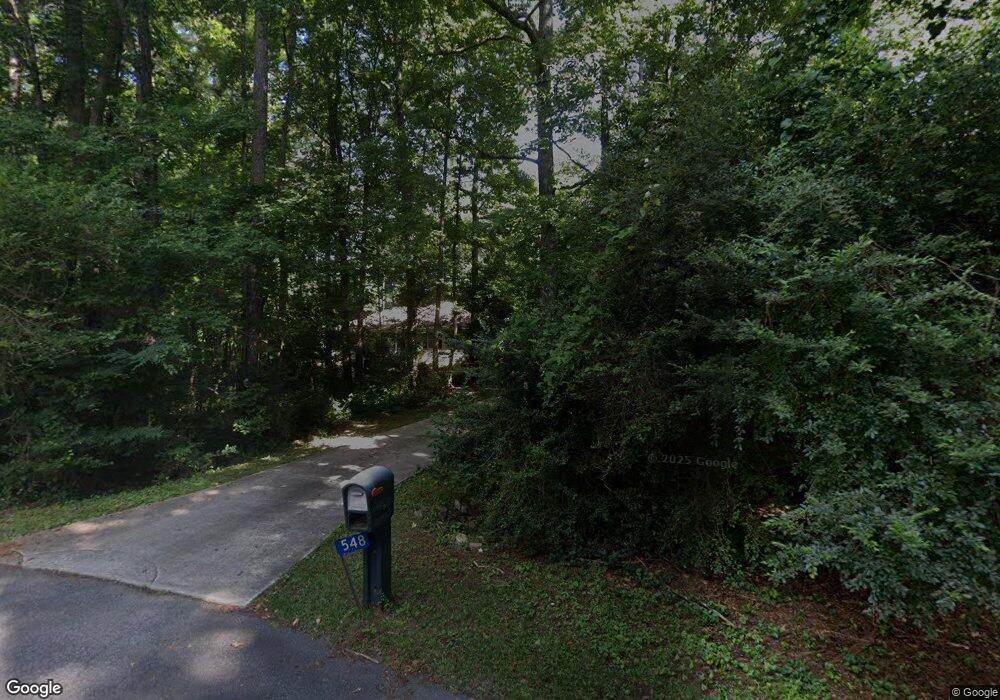
548 Cherokee Cir Rutledge, GA 30663
Estimated Value: $311,109 - $351,000
3
Beds
2
Baths
1,542
Sq Ft
$221/Sq Ft
Est. Value
About This Home
This home is located at 548 Cherokee Cir, Rutledge, GA 30663 and is currently estimated at $340,527, approximately $220 per square foot. 548 Cherokee Cir is a home located in Morgan County with nearby schools including Morgan County Primary School, Morgan County Elementary School, and Morgan County Middle School.
Ownership History
Date
Name
Owned For
Owner Type
Purchase Details
Closed on
Nov 14, 2016
Sold by
Spann Dorothy A
Bought by
Harris Stanley
Current Estimated Value
Home Financials for this Owner
Home Financials are based on the most recent Mortgage that was taken out on this home.
Original Mortgage
$166,402
Outstanding Balance
$133,086
Interest Rate
3.47%
Mortgage Type
VA
Estimated Equity
$207,441
Purchase Details
Closed on
Jan 4, 2013
Sold by
Spann William C
Bought by
Spann William C and Spann Dorothy A
Purchase Details
Closed on
Nov 22, 2002
Sold by
Spann William Colbert
Bought by
Spann William C
Purchase Details
Closed on
Nov 18, 2002
Sold by
Spann William C 111
Bought by
Spann William Colbert
Purchase Details
Closed on
Dec 31, 1996
Sold by
Hollis & Sons Inc
Bought by
Spann William C 111
Purchase Details
Closed on
Jun 24, 1996
Sold by
2Km Partnership
Bought by
Hollis & Sons Inc
Purchase Details
Closed on
Nov 6, 1989
Sold by
Bank Of Morgan County
Bought by
2Km Partnership
Create a Home Valuation Report for This Property
The Home Valuation Report is an in-depth analysis detailing your home's value as well as a comparison with similar homes in the area
Home Values in the Area
Average Home Value in this Area
Purchase History
| Date | Buyer | Sale Price | Title Company |
|---|---|---|---|
| Harris Stanley | $162,900 | -- | |
| Spann William C | -- | -- | |
| Spann William C | -- | -- | |
| Spann William Colbert | -- | -- | |
| Spann William C 111 | $103,800 | -- | |
| Hollis & Sons Inc | $14,800 | -- | |
| 2Km Partnership | -- | -- |
Source: Public Records
Mortgage History
| Date | Status | Borrower | Loan Amount |
|---|---|---|---|
| Open | Harris Stanley | $166,402 |
Source: Public Records
Tax History Compared to Growth
Tax History
| Year | Tax Paid | Tax Assessment Tax Assessment Total Assessment is a certain percentage of the fair market value that is determined by local assessors to be the total taxable value of land and additions on the property. | Land | Improvement |
|---|---|---|---|---|
| 2025 | $2,556 | $100,663 | $18,000 | $82,663 |
| 2024 | $2,177 | $84,391 | $12,000 | $72,391 |
| 2023 | $1,876 | $70,532 | $8,000 | $62,532 |
| 2022 | $1,789 | $64,663 | $8,000 | $56,663 |
| 2021 | $1,796 | $64,663 | $8,000 | $56,663 |
| 2020 | $1,814 | $64,663 | $8,000 | $56,663 |
| 2019 | $1,842 | $64,663 | $8,000 | $56,663 |
| 2018 | $1,868 | $64,663 | $8,000 | $56,663 |
| 2017 | $1,848 | $63,061 | $11,200 | $51,861 |
| 2016 | $1,278 | $57,792 | $8,000 | $49,792 |
| 2015 | $1,228 | $55,600 | $8,000 | $47,600 |
| 2014 | $1,170 | $54,960 | $6,000 | $48,960 |
| 2013 | -- | $43,600 | $6,000 | $37,600 |
Source: Public Records
Map
Nearby Homes
- 0 Reese Rd Unit 10622381
- 0 Reese Rd Unit 25651133
- 294 Tuscany Dr
- 1151 Fears Rd
- 0 W Dixie Hwy Unit 10499573
- 0 Fairplay St Unit 10637174
- 224 Hollis St
- 120 Hidden Falls Ct
- 3641 Davis Academy Rd
- 0 Hawkins Academy Rd Unit 10561655
- 00 Fears Rd
- 00 Fears Rd
- 1031 Graham Dr
- 5521 Atlanta Hwy
- 5761 W Dixie Hwy
- 0 Fears Rd Unit 10569285
- 1310 Deerwood Dr
- 5841 Atlanta Hwy
- 2470 Fears Rd
- 1051 Long Wood Dr
- 562 Indian Creek Trail
- 546 Cherokee Cir
- LOT 12 Indian Creek Trail
- 510 Indian Creek Trail
- 550 Cherokee Cir
- 508 Indian Creek Trail
- 512 Indian Creek Trail
- 552 Indian Creek Trail
- 544 Indian Creek Trail
- 518 Indian Creek Trail
- 0 Indian Creek Trail Unit 10386016
- 0 Indian Creek Trail Unit 7463151
- 0 Indian Creek Trail Unit 10367025
- 0 Indian Creek Trail Unit 7411144
- 0 Indian Creek Trail Unit 10326980
- 0 Indian Creek Trail Unit 7038789
- 565 Indian Creek Trail
- 565 Indian Creek Trail Unit 2
- 563 Indian Creek Trail
- 514 Indian Creek Trail