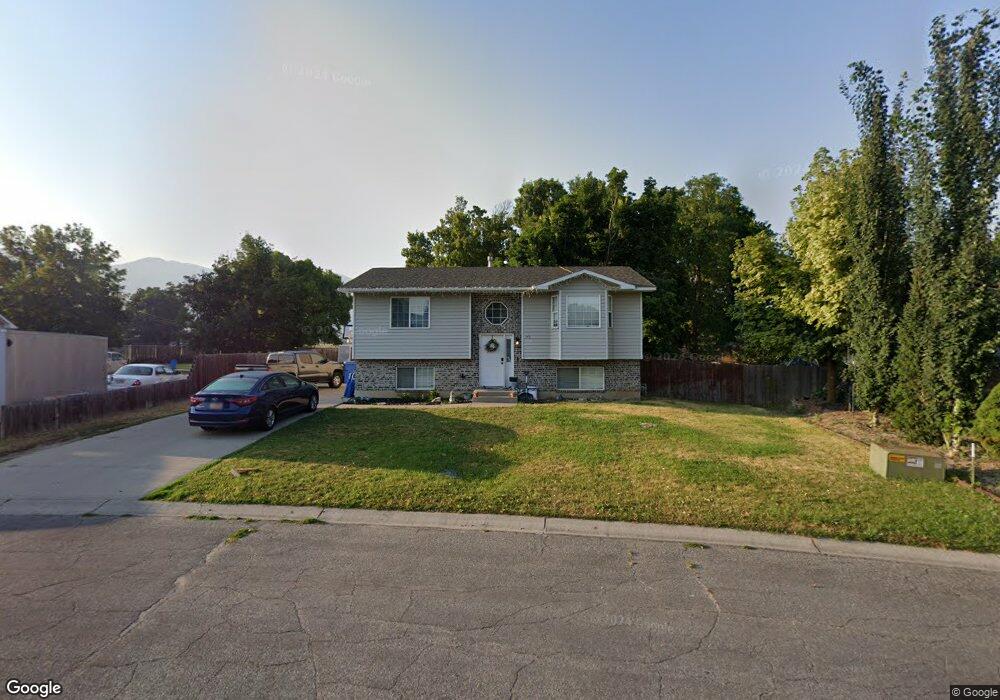
548 E 1980 N North Logan, UT 84341
Estimated Value: $384,737 - $521,000
4
Beds
2
Baths
1,960
Sq Ft
$225/Sq Ft
Est. Value
About This Home
This home is located at 548 E 1980 N, North Logan, UT 84341 and is currently estimated at $441,684, approximately $225 per square foot. 548 E 1980 N is a home located in Cache County with nearby schools including Greenville School, Cedar Ridge School, and North Cache Middle School.
Ownership History
Date
Name
Owned For
Owner Type
Purchase Details
Closed on
Jun 29, 2021
Sold by
Mumford Trenton E and Mumford Ashley B
Bought by
Staley Derek P and Staley Cynthia
Current Estimated Value
Home Financials for this Owner
Home Financials are based on the most recent Mortgage that was taken out on this home.
Original Mortgage
$291,000
Outstanding Balance
$262,890
Interest Rate
2.9%
Mortgage Type
New Conventional
Estimated Equity
$178,794
Purchase Details
Closed on
May 5, 2006
Sold by
Thompson Fletcher Carolyn and Thompson Fletcher Jared
Bought by
Mumford Trenton E and Mumford Ashley B
Home Financials for this Owner
Home Financials are based on the most recent Mortgage that was taken out on this home.
Original Mortgage
$133,898
Interest Rate
6.29%
Mortgage Type
FHA
Create a Home Valuation Report for This Property
The Home Valuation Report is an in-depth analysis detailing your home's value as well as a comparison with similar homes in the area
Home Values in the Area
Average Home Value in this Area
Purchase History
| Date | Buyer | Sale Price | Title Company |
|---|---|---|---|
| Staley Derek P | -- | Hickman Land Title Logan | |
| Mumford Trenton E | -- | American Secure Title |
Source: Public Records
Mortgage History
| Date | Status | Borrower | Loan Amount |
|---|---|---|---|
| Open | Staley Derek P | $291,000 | |
| Previous Owner | Mumford Trenton E | $133,898 |
Source: Public Records
Tax History
| Year | Tax Paid | Tax Assessment Tax Assessment Total Assessment is a certain percentage of the fair market value that is determined by local assessors to be the total taxable value of land and additions on the property. | Land | Improvement |
|---|---|---|---|---|
| 2025 | $1,560 | $218,420 | $0 | $0 |
| 2024 | $1,748 | $227,645 | $0 | $0 |
| 2023 | $1,737 | $211,750 | $0 | $0 |
| 2022 | $1,541 | $179,520 | $0 | $0 |
| 2021 | $1,440 | $260,110 | $62,500 | $197,610 |
| 2020 | $1,283 | $217,336 | $62,500 | $154,836 |
| 2019 | $1,344 | $217,336 | $62,500 | $154,836 |
| 2018 | $1,257 | $197,140 | $62,500 | $134,640 |
| 2017 | $1,166 | $96,195 | $0 | $0 |
| 2016 | $1,184 | $96,195 | $0 | $0 |
| 2015 | $963 | $77,990 | $0 | $0 |
| 2014 | $941 | $77,990 | $0 | $0 |
| 2013 | -- | $77,990 | $0 | $0 |
Source: Public Records
Map
Nearby Homes
- 2048 N 350 E
- 272 E 1725 N Unit 3
- 253 E 1725 N Unit 2
- 710 E 2160 N
- 395 E 1530 N
- 2168 N 750 E
- 741 E 2200 N
- 239 E 1530 N
- 327 E 2230 N Unit A
- 385 E 2280 N Unit D
- 1238 E Talmage Ln Unit 33
- 1366 N Talmage Ln Unit 35
- 1367 E 1280 N
- 1261 E Talmage Ln Unit 59
- 1241 E Talmage Ln Unit 31
- 1246 E Talmage Ln Unit 32
- 2284 N 740 E
- 1100 E 1900 N Unit 10
- 643 E 1280 N
- 648 E 1280 N
Your Personal Tour Guide
Ask me questions while you tour the home.