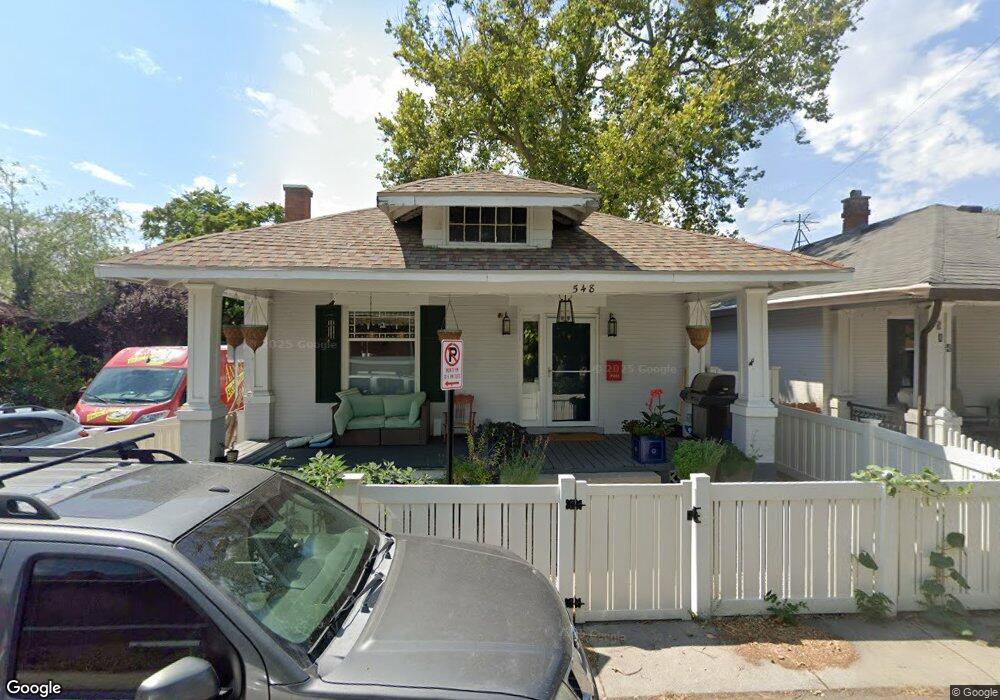
548 Lowell Ave Salt Lake City, UT 84102
Central City NeighborhoodEstimated Value: $504,000 - $553,449
4
Beds
1
Bath
1,399
Sq Ft
$374/Sq Ft
Est. Value
About This Home
This home is located at 548 Lowell Ave, Salt Lake City, UT 84102 and is currently estimated at $522,612, approximately $373 per square foot. 548 Lowell Ave is a home located in Salt Lake County with nearby schools including Bennion Elementary School, Liberty Elementary School, and Highland High School.
Ownership History
Date
Name
Owned For
Owner Type
Purchase Details
Closed on
Jun 14, 2022
Sold by
Loc-Carrillo Catherine M
Bought by
Willmon Russell
Current Estimated Value
Purchase Details
Closed on
Oct 18, 2018
Sold by
Willmon Russell
Bought by
Willmon Russell and Carrillo Catherine M Loc
Home Financials for this Owner
Home Financials are based on the most recent Mortgage that was taken out on this home.
Original Mortgage
$240,000
Interest Rate
4.6%
Mortgage Type
New Conventional
Purchase Details
Closed on
Apr 21, 2014
Sold by
Agm Squard Llc
Bought by
Willmon Russell
Home Financials for this Owner
Home Financials are based on the most recent Mortgage that was taken out on this home.
Original Mortgage
$213,750
Interest Rate
4.28%
Mortgage Type
New Conventional
Purchase Details
Closed on
Oct 29, 2013
Sold by
Sudlesky Rocky M
Bought by
Agm Squared Llc
Purchase Details
Closed on
Oct 3, 2003
Sold by
Federal Home Loan Mortgage Corporation
Bought by
Sudlesky Rocky M
Home Financials for this Owner
Home Financials are based on the most recent Mortgage that was taken out on this home.
Original Mortgage
$95,000
Interest Rate
5.72%
Mortgage Type
Unknown
Purchase Details
Closed on
Mar 24, 2000
Sold by
Anderson Stacy D and Anderson Carolyn
Bought by
Holbrook Tyson
Home Financials for this Owner
Home Financials are based on the most recent Mortgage that was taken out on this home.
Original Mortgage
$100,000
Interest Rate
8.34%
Purchase Details
Closed on
Jul 30, 1998
Sold by
Johnson Garth
Bought by
Anderson Stacy D and Anderson Carolyn
Home Financials for this Owner
Home Financials are based on the most recent Mortgage that was taken out on this home.
Original Mortgage
$73,000
Interest Rate
6.9%
Purchase Details
Closed on
Jun 12, 1998
Sold by
Bekkemellom Barney Borg
Bought by
Johnson Garth
Home Financials for this Owner
Home Financials are based on the most recent Mortgage that was taken out on this home.
Original Mortgage
$73,000
Interest Rate
6.9%
Create a Home Valuation Report for This Property
The Home Valuation Report is an in-depth analysis detailing your home's value as well as a comparison with similar homes in the area
Home Values in the Area
Average Home Value in this Area
Purchase History
| Date | Buyer | Sale Price | Title Company |
|---|---|---|---|
| Willmon Russell | -- | None Listed On Document | |
| Willmon Russell | -- | Lsi Title Co | |
| Willmon Russell | -- | Bis Sky Title Ins Agcy | |
| Agm Squared Llc | -- | First American Title | |
| Sudlesky Rocky M | -- | First American Title | |
| Holbrook Tyson | -- | Surety Title Agency | |
| Anderson Stacy D | -- | -- | |
| Johnson Garth | -- | -- |
Source: Public Records
Mortgage History
| Date | Status | Borrower | Loan Amount |
|---|---|---|---|
| Previous Owner | Willmon Russell | $240,000 | |
| Previous Owner | Willmon Russell | $213,750 | |
| Previous Owner | Sudlesky Rocky M | $95,000 | |
| Previous Owner | Holbrook Tyson | $100,000 | |
| Previous Owner | Anderson Stacy D | $73,000 |
Source: Public Records
Tax History Compared to Growth
Tax History
| Year | Tax Paid | Tax Assessment Tax Assessment Total Assessment is a certain percentage of the fair market value that is determined by local assessors to be the total taxable value of land and additions on the property. | Land | Improvement |
|---|---|---|---|---|
| 2025 | $2,638 | $530,800 | $147,800 | $383,000 |
| 2024 | $2,638 | $503,300 | $139,900 | $363,400 |
| 2023 | $2,626 | $483,000 | $158,500 | $324,500 |
| 2022 | $2,832 | $488,700 | $107,900 | $380,800 |
| 2021 | $2,491 | $389,100 | $84,500 | $304,600 |
| 2020 | $2,118 | $315,000 | $56,800 | $258,200 |
| 2019 | $2,136 | $298,900 | $42,000 | $256,900 |
| 2018 | $0 | $280,300 | $42,000 | $238,300 |
| 2017 | $2,188 | $279,300 | $42,000 | $237,300 |
| 2016 | $2,078 | $251,900 | $39,800 | $212,100 |
| 2015 | $1,217 | $139,800 | $39,000 | $100,800 |
| 2014 | $1,221 | $139,200 | $40,200 | $99,000 |
Source: Public Records
Map
Nearby Homes