548 Main St Medford, MA 02155
South Medford NeighborhoodEstimated Value: $906,000 - $1,070,386
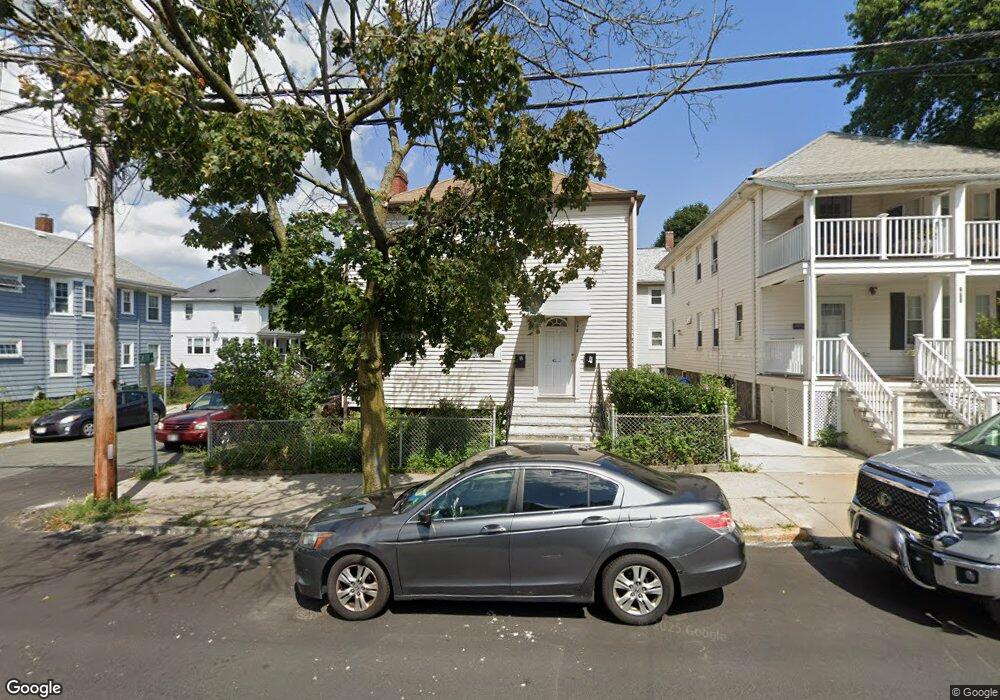
About This Home
This home is located at 548 Main St, Medford, MA 02155 and is currently estimated at $993,097, approximately $470 per square foot. 548 Main St is a home located in Middlesex County with nearby schools including Medford High School, St. Clement Elementary School, and Bright Future Educare Center.
Ownership History
We collect this data history from publicly available records. To have your information removed, we recommend requesting removal directly through your county’s website.
Purchase Details
Home Financials for this Owner
Home Financials are based on the most recent Mortgage that was taken out on this home.Home Values in the Area
Average Home Value in this Area
Purchase History
We collect this data history from publicly available records. To have your information removed, we recommend requesting removal directly through your county’s website.
| Date | Buyer | Sale Price | Title Company |
|---|---|---|---|
| $225,000 | -- |
Mortgage History
We collect this data history from publicly available records. To have your information removed, we recommend requesting removal directly through your county’s website.
| Date | Status | Borrower | Loan Amount |
|---|---|---|---|
| Open | $189,500 | ||
| Closed | $180,000 |
Tax History
We collect this data history from publicly available records. To have your information removed, we recommend requesting removal directly through your county’s website.
| Year | Tax Paid | Tax Assessment Tax Assessment Total Assessment is a certain percentage of the fair market value that is determined by local assessors to be the total taxable value of land and additions on the property. | Land | Improvement |
|---|---|---|---|---|
| 2025 | $7,704 | $875,500 | $299,900 | $575,600 |
| 2024 | $6,934 | $813,900 | $285,700 | $528,200 |
| 2023 | $6,799 | $786,000 | $267,000 | $519,000 |
| 2022 | $6,863 | $761,700 | $242,700 | $519,000 |
| 2021 | $6,436 | $684,000 | $231,100 | $452,900 |
| 2020 | $6,346 | $691,300 | $231,100 | $460,200 |
| 2019 | $6,047 | $629,900 | $210,100 | $419,800 |
| 2018 | $5,747 | $561,200 | $191,000 | $370,200 |
| 2017 | $5,387 | $510,100 | $178,500 | $331,600 |
| 2016 | $5,259 | $470,000 | $162,300 | $307,700 |
| 2015 | $4,958 | $423,800 | $154,600 | $269,200 |
Map
- 549 Main St
- 16 Hale Ave
- 7 Smith St Unit 1
- 7 Smith St Unit 2
- 7 Smith St
- 562 Main St
- 87 Medford St Unit 407
- 519 Broadway Unit 407
- 474 Broadway Unit 46
- 12 Charles e Ryan Rd
- 495 Main St
- 452 Broadway
- 446 Broadway Unit 1
- 446 Broadway Unit 2
- 5 Norwood Ave Unit 2
- 13 Leyden St
- 63 Albion St
- 595 Broadway Unit 302
- 595 Broadway Unit 303
- 31 Henry St
Ask me questions while you tour the home.