Estimated Value: $177,000 - $276,000
4
Beds
2
Baths
1,968
Sq Ft
$119/Sq Ft
Est. Value
About This Home
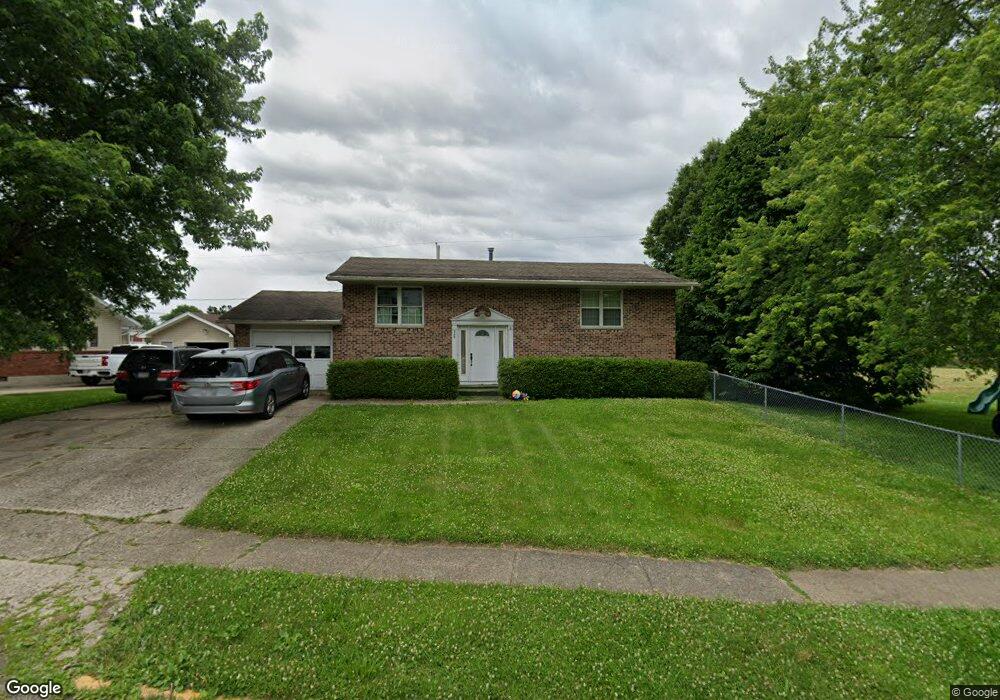
This home is located at 548 N Monroe Dr, Xenia, OH 45385 and is currently estimated at $234,730, approximately $119 per square foot. 548 N Monroe Dr is a home located in Greene County with nearby schools including Xenia High School, Summit Academy Community School for Alternative Learners - Xenia, and Legacy Christian Academy.
Ownership History
Date
Name
Owned For
Owner Type
Purchase Details
Closed on
May 12, 2017
Sold by
Collett Jason F
Bought by
Walch David
Current Estimated Value
Home Financials for this Owner
Home Financials are based on the most recent Mortgage that was taken out on this home.
Original Mortgage
$129,510
Outstanding Balance
$107,763
Interest Rate
4.12%
Mortgage Type
FHA
Estimated Equity
$126,967
Purchase Details
Closed on
Feb 28, 2007
Sold by
Frye Eugene R and Stafford Laura
Bought by
Collett Jason F
Home Financials for this Owner
Home Financials are based on the most recent Mortgage that was taken out on this home.
Original Mortgage
$130,000
Interest Rate
6.28%
Mortgage Type
VA
Purchase Details
Closed on
Nov 3, 1998
Sold by
Frye Frances I and Frye Frances Irene
Bought by
Frye Eugene R
Create a Home Valuation Report for This Property
The Home Valuation Report is an in-depth analysis detailing your home's value as well as a comparison with similar homes in the area
Home Values in the Area
Average Home Value in this Area
Purchase History
| Date | Buyer | Sale Price | Title Company |
|---|---|---|---|
| Walch David | $131,900 | None Available | |
| Collett Jason F | $130,000 | Attorney | |
| Frye Eugene R | -- | -- |
Source: Public Records
Mortgage History
| Date | Status | Borrower | Loan Amount |
|---|---|---|---|
| Open | Walch David | $129,510 | |
| Previous Owner | Collett Jason F | $130,000 |
Source: Public Records
Tax History Compared to Growth
Tax History
| Year | Tax Paid | Tax Assessment Tax Assessment Total Assessment is a certain percentage of the fair market value that is determined by local assessors to be the total taxable value of land and additions on the property. | Land | Improvement |
|---|---|---|---|---|
| 2024 | $2,575 | $60,170 | $10,640 | $49,530 |
| 2023 | $2,575 | $60,170 | $10,640 | $49,530 |
| 2022 | $2,209 | $44,030 | $6,650 | $37,380 |
| 2021 | $2,239 | $44,030 | $6,650 | $37,380 |
| 2020 | $2,145 | $44,030 | $6,650 | $37,380 |
| 2019 | $2,253 | $43,540 | $8,740 | $34,800 |
| 2018 | $2,262 | $43,540 | $8,740 | $34,800 |
| 2017 | $2,197 | $43,540 | $8,740 | $34,800 |
| 2016 | $2,142 | $40,460 | $8,740 | $31,720 |
| 2015 | $2,148 | $40,460 | $8,740 | $31,720 |
| 2014 | $2,057 | $40,460 | $8,740 | $31,720 |
Source: Public Records
Map
Nearby Homes
- 479 N Stadium Dr
- 348 S Stadium Dr
- 568 Louise Dr
- 508 Marshall Dr
- 513 Redbud Ln
- 119 Park Dr
- 610 Saxony Dr
- 659 N King St
- 516 N King St
- 656 Eden Roc Dr
- 137 Pleasant St
- 878 N Detroit St
- 902 N Detroit St
- 613 N West St
- 645 E Church St
- 612 E Market St
- 541 E Main St
- 1038 Frederick Dr
- 607 E Main St
- 1171 N Detroit St
- 528 N Monroe Dr
- 559 N Monroe Dr
- 321 Marshall Dr
- 510 N Monroe Dr
- 340 Marshall Dr
- 343 Marshall Dr
- 577 N Monroe Dr
- 513 N Monroe Dr
- 486 N Monroe Dr
- 591 N Monroe Dr
- 352 Marshall Dr
- 497 N Monroe Dr
- 355 Marshall Dr
- 603 N Monroe Dr
- 476 N Monroe Dr
- 482 N Stadium Dr
- 716 Louise Dr
- 728 Louise Dr
- 496 N Stadium Dr
- 466 N Stadium Dr