Estimated Value: $324,429 - $371,000
3
Beds
3
Baths
2,511
Sq Ft
$142/Sq Ft
Est. Value
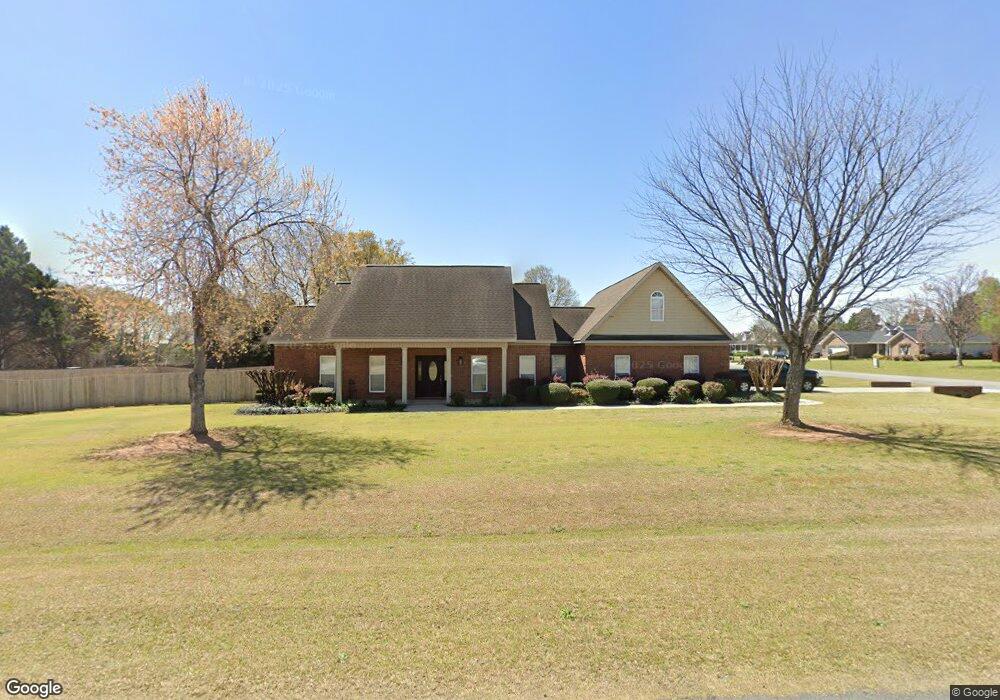
About This Home
This home is located at 548 Southland Trail, Byron, GA 31008 and is currently estimated at $355,357, approximately $141 per square foot. 548 Southland Trail is a home located in Peach County with nearby schools including Byron Elementary School, Byron Middle School, and Peach County High School.
Ownership History
Date
Name
Owned For
Owner Type
Purchase Details
Closed on
Apr 19, 2010
Sold by
Daniel Charles Thomas and Daniel Sharon A
Bought by
Christian William Stanley and Christian Natasha Leigh
Current Estimated Value
Home Financials for this Owner
Home Financials are based on the most recent Mortgage that was taken out on this home.
Original Mortgage
$193,296
Outstanding Balance
$128,358
Interest Rate
4.94%
Mortgage Type
FHA
Estimated Equity
$226,999
Purchase Details
Closed on
Oct 12, 2004
Sold by
England James A Dana Jill
Bought by
Daniel Charles Thomas and Daniel Sharon A
Purchase Details
Closed on
Jun 14, 2002
Sold by
England James A
Bought by
England James A Dana Jill
Purchase Details
Closed on
Jan 31, 2002
Sold by
H & H Land Development Co
Bought by
Stokes Freeman
Purchase Details
Closed on
Jul 2, 1999
Bought by
H & H Land Development Co
Create a Home Valuation Report for This Property
The Home Valuation Report is an in-depth analysis detailing your home's value as well as a comparison with similar homes in the area
Home Values in the Area
Average Home Value in this Area
Purchase History
| Date | Buyer | Sale Price | Title Company |
|---|---|---|---|
| Christian William Stanley | $195,900 | -- | |
| Daniel Charles Thomas | $190,000 | -- | |
| England James A Dana Jill | -- | -- | |
| England James A | $177,400 | -- | |
| Stokes Freeman | -- | -- | |
| H & H Land Development Co | -- | -- |
Source: Public Records
Mortgage History
| Date | Status | Borrower | Loan Amount |
|---|---|---|---|
| Open | Christian William Stanley | $193,296 |
Source: Public Records
Tax History Compared to Growth
Tax History
| Year | Tax Paid | Tax Assessment Tax Assessment Total Assessment is a certain percentage of the fair market value that is determined by local assessors to be the total taxable value of land and additions on the property. | Land | Improvement |
|---|---|---|---|---|
| 2024 | $3,808 | $108,200 | $13,960 | $94,240 |
| 2023 | $3,748 | $105,840 | $11,160 | $94,680 |
| 2022 | $2,481 | $94,160 | $11,160 | $83,000 |
| 2021 | $2,494 | $81,880 | $11,160 | $70,720 |
| 2020 | $2,458 | $80,720 | $11,160 | $69,560 |
| 2019 | $2,460 | $80,400 | $11,160 | $69,240 |
| 2018 | $2,472 | $80,400 | $11,160 | $69,240 |
| 2017 | $2,484 | $80,400 | $11,160 | $69,240 |
| 2016 | $2,474 | $80,400 | $11,160 | $69,240 |
| 2015 | $2,478 | $80,400 | $11,160 | $69,240 |
| 2014 | $2,482 | $80,400 | $11,160 | $69,240 |
| 2013 | -- | $80,400 | $11,160 | $69,240 |
Source: Public Records
Map
Nearby Homes
- 408 Dixieland Dr
- 302 Southland Trail
- 510 Southland Trail
- 51 Allred Rd
- 81 Idell Ct
- 0 Highway 42 Unit 10576098
- 0 Moseley Rd Unit 10582548
- 0 Moseley Rd Unit 255314
- 0 Moseley Rd Unit 180905
- 254 Shantz Way Unit (LOT A44)
- 35 Falcon Crest Way
- 125 Peregrine Dr
- 0 Barker Rd Unit 243030
- 0 Barker Rd Unit 14258525
- 0 Barker Rd Unit 175053
- 113 Sweetspire Ln
- 1046 Walker Rd
- 104 Chickasaw Ct
- 135 Abelia Ln
- 112 Abelia Ln
- 546 Southland Trail
- Lot 20 Southland Trail
- Lot 33 Southland Trail
- Lot 36 Southland Trail
- 121 Orchard Park Dr
- 000 Peach Pkwy
- 0 Peach Pkwy Unit 20175926
- 0 Peach Pkwy Unit 241744
- 0 Peach Pkwy Unit 8591535
- 0 Peach Pkwy Unit 217451
- 0 Peach Pkwy Unit 7174112
- 0 Peach Pkwy
- 544 Southland Trail
- 120 Orchard Park Dr
- 119 Orchard Park Dr
- 533 Southland Trail
- 542 Southland Trail
- 118 Orchard Park Dr
- 531 Southland Trail
- 540 Southland Trail