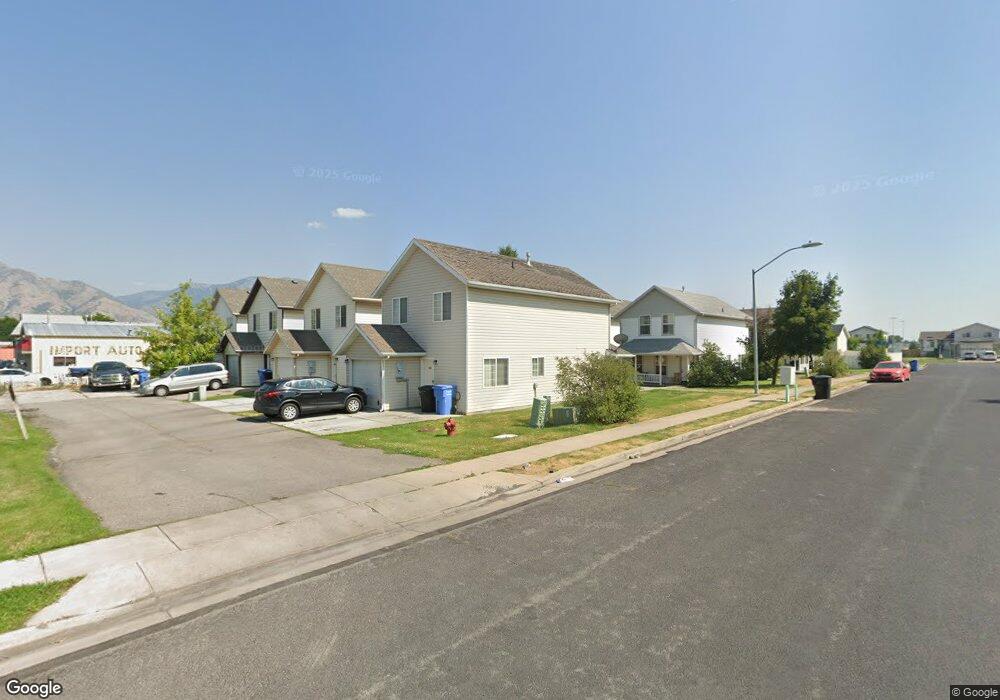
548 W 1380 N Logan, UT 84341
Bridger NeighborhoodEstimated Value: $306,000 - $346,000
3
Beds
3
Baths
1,263
Sq Ft
$254/Sq Ft
Est. Value
About This Home
This home is located at 548 W 1380 N, Logan, UT 84341 and is currently estimated at $320,714, approximately $253 per square foot. 548 W 1380 N is a home located in Cache County with nearby schools including Bridger School, Mount Logan Middle School, and Logan High School.
Ownership History
Date
Name
Owned For
Owner Type
Purchase Details
Closed on
May 30, 2017
Sold by
Whitaker Kevin P and Whitaker Kaitlin
Bought by
Jorgensen Susan
Current Estimated Value
Purchase Details
Closed on
May 24, 2017
Sold by
Jorgensen Susan
Bought by
Daisywok Properties 1 Llc
Purchase Details
Closed on
Mar 7, 2011
Sold by
Evans David and Evans Floridalma
Bought by
Whitaker Kevin P and Whitaker Kaitlin
Home Financials for this Owner
Home Financials are based on the most recent Mortgage that was taken out on this home.
Original Mortgage
$94,541
Interest Rate
3.87%
Mortgage Type
FHA
Purchase Details
Closed on
Apr 29, 2002
Sold by
Household Mtg Services Inc
Bought by
Kuiper Frankie Jo
Home Financials for this Owner
Home Financials are based on the most recent Mortgage that was taken out on this home.
Original Mortgage
$90,578
Interest Rate
7.08%
Mortgage Type
FHA
Create a Home Valuation Report for This Property
The Home Valuation Report is an in-depth analysis detailing your home's value as well as a comparison with similar homes in the area
Home Values in the Area
Average Home Value in this Area
Purchase History
| Date | Buyer | Sale Price | Title Company |
|---|---|---|---|
| Jorgensen Susan | -- | American Secure Title | |
| Daisywok Properties 1 Llc | -- | American Secure Title | |
| Whitaker Kevin P | -- | First American Union Heights | |
| Kuiper Frankie Jo | -- | American Secure Title |
Source: Public Records
Mortgage History
| Date | Status | Borrower | Loan Amount |
|---|---|---|---|
| Previous Owner | Whitaker Kevin P | $94,541 | |
| Previous Owner | Kuiper Frankie Jo | $90,578 | |
| Closed | Kuiper Frankie Jo | $3,000 |
Source: Public Records
Tax History Compared to Growth
Tax History
| Year | Tax Paid | Tax Assessment Tax Assessment Total Assessment is a certain percentage of the fair market value that is determined by local assessors to be the total taxable value of land and additions on the property. | Land | Improvement |
|---|---|---|---|---|
| 2025 | $1,169 | $151,200 | $0 | $0 |
| 2024 | $1,207 | $151,200 | $0 | $0 |
| 2023 | $1,262 | $150,650 | $0 | $0 |
| 2022 | $1,351 | $150,650 | $0 | $0 |
| 2021 | $1,185 | $204,130 | $25,000 | $179,130 |
| 2020 | $906 | $140,495 | $25,000 | $115,495 |
| 2019 | $947 | $140,494 | $25,000 | $115,494 |
| 2018 | $926 | $125,430 | $25,000 | $100,430 |
| 2017 | $893 | $63,965 | $0 | $0 |
| 2016 | $926 | $60,115 | $0 | $0 |
| 2015 | $821 | $56,610 | $0 | $0 |
| 2014 | $742 | $56,610 | $0 | $0 |
| 2013 | -- | $56,610 | $0 | $0 |
Source: Public Records
Map
Nearby Homes
- 559 W 1350 N Unit 41
- 539 W 1465 N Unit 17-102
- 514 W 1490 N Unit 102
- 1492 N 565 W Unit 101
- 1515 N 450 W Unit 103
- 1565 N 565 W Unit 101
- 1584 N 565 W Unit 104
- 446 W 1595 N Unit 103
- 2200 N 220 W
- 1762 N 460 W Unit 103-10
- 2 Somerset Place
- Park Avenue 1600 Plan at Park Avenue 1600
- 894 N 400 W
- 873 N 480 W
- 60 Hampton Place
- 259 W 1800 N
- 1030 N 130 W Unit 100
- 1926 Lavender Loop Unit 6
- 897 N 250 W
- 430 W 810 N