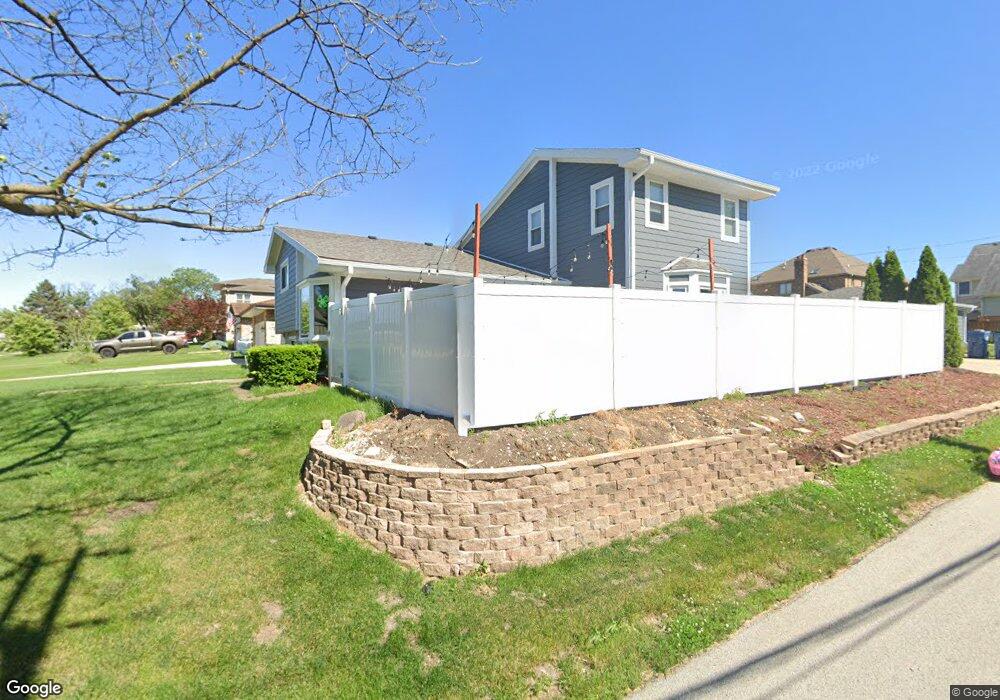
548 W Armitage Ave Elmhurst, IL 60126
Estimated Value: $596,000 - $699,000
4
Beds
3
Baths
2,231
Sq Ft
$288/Sq Ft
Est. Value
About This Home
This home is located at 548 W Armitage Ave, Elmhurst, IL 60126 and is currently estimated at $643,222, approximately $288 per square foot. 548 W Armitage Ave is a home located in DuPage County with nearby schools including Emerson Elementary School, Churchville Middle School, and York Community High School.
Create a Home Valuation Report for This Property
The Home Valuation Report is an in-depth analysis detailing your home's value as well as a comparison with similar homes in the area
Home Values in the Area
Average Home Value in this Area
Tax History Compared to Growth
Tax History
| Year | Tax Paid | Tax Assessment Tax Assessment Total Assessment is a certain percentage of the fair market value that is determined by local assessors to be the total taxable value of land and additions on the property. | Land | Improvement |
|---|---|---|---|---|
| 2024 | $9,954 | $170,534 | $75,080 | $95,454 |
| 2023 | $9,182 | $156,770 | $69,020 | $87,750 |
| 2022 | $8,725 | $148,440 | $65,410 | $83,030 |
| 2021 | $8,353 | $142,180 | $62,650 | $79,530 |
| 2020 | $7,859 | $136,190 | $60,010 | $76,180 |
| 2019 | $7,779 | $130,950 | $57,700 | $73,250 |
| 2018 | $7,166 | $120,410 | $54,960 | $65,450 |
| 2017 | $7,025 | $115,080 | $52,530 | $62,550 |
| 2016 | $6,729 | $106,250 | $48,500 | $57,750 |
| 2015 | $6,595 | $98,150 | $44,800 | $53,350 |
| 2014 | $6,230 | $86,020 | $36,960 | $49,060 |
| 2013 | $6,205 | $87,770 | $37,710 | $50,060 |
Source: Public Records
Map
Nearby Homes
- 656 W Comstock Ave
- 655 W Comstock Ave
- 468 N Highland Ave
- 412 N Ridgeland Ave
- 442 N Oak St
- 322 N Highland Ave
- 901 E Krage Dr
- 407 W North Ave
- 902 E Krage Dr
- 724 N Junior Terrace
- 285 N Ridgeland Ave
- 284 N Highland Ave
- 600 E Armitage Ave
- 251 W Armitage Ave
- 456 N Elm Ave
- 196 N Walnut St
- 437 E Lorraine Ave
- 204 E Hill St
- 17W517 Manor Ln
- 1101 N Princeton Ave
- 542 W Armitage Ave
- 558 W Armitage Ave
- 538 W Armitage Ave
- 562 W Armitage Ave
- 559 W Fay Ave
- 534 W Armitage Ave
- 549 W Armitage Ave
- 570 W Armitage Ave
- 561 W Fay Ave
- 543 W Armitage Ave
- 555 W Fay Ave
- 545 W Armitage Ave
- 530 W Armitage Ave
- 565 W Fay Ave
- 537 W Armitage Ave
- 547 W Fay Ave
- 561 W Armitage Ave
- 565 W Armitage Ave
- 569 W Fay Ave