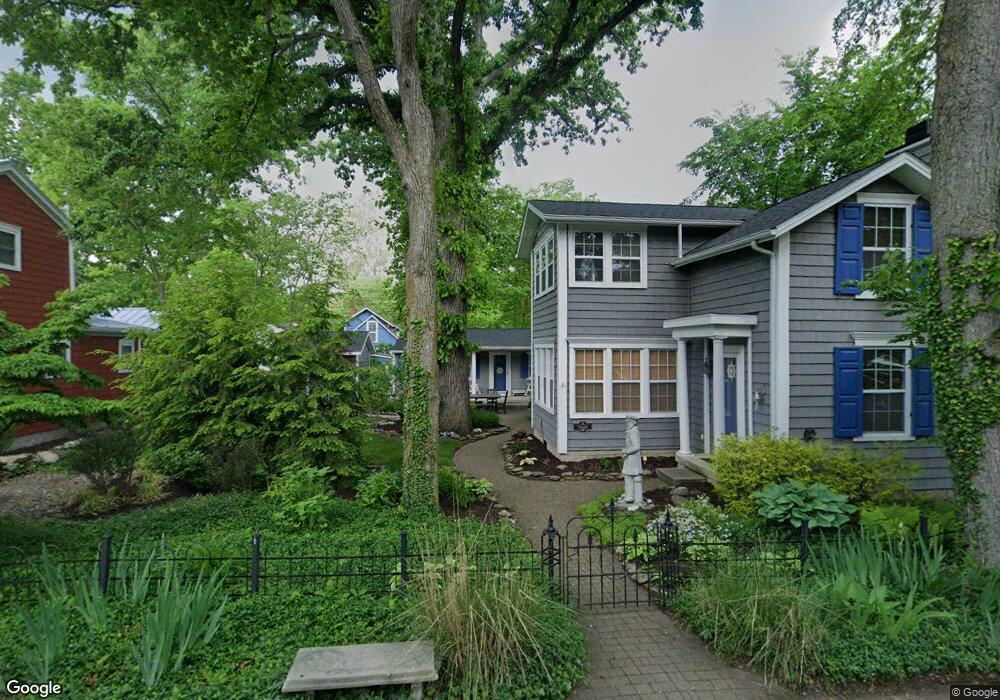
548 Walnut Ave Lakeside Marblehead, OH 43440
Estimated Value: $479,000 - $727,000
3
Beds
1
Bath
1,020
Sq Ft
$538/Sq Ft
Est. Value
About This Home
This home is located at 548 Walnut Ave, Lakeside Marblehead, OH 43440 and is currently estimated at $548,429, approximately $537 per square foot. 548 Walnut Ave is a home located in Ottawa County with nearby schools including Danbury Middle School and Danbury High School.
Ownership History
Date
Name
Owned For
Owner Type
Purchase Details
Closed on
Jul 7, 2006
Sold by
Haag Robert D and Haag Ruth S
Bought by
Cavileer John F and Cavileer Kathleen A
Current Estimated Value
Purchase Details
Closed on
Jul 23, 2002
Sold by
Baker Frank B
Bought by
Haag Robert D and Haag Ruth S
Home Financials for this Owner
Home Financials are based on the most recent Mortgage that was taken out on this home.
Original Mortgage
$120,000
Interest Rate
5.75%
Mortgage Type
New Conventional
Purchase Details
Closed on
Nov 9, 1995
Sold by
Bohnert George P
Bought by
Baker Frank B and Baker Brenda G
Home Financials for this Owner
Home Financials are based on the most recent Mortgage that was taken out on this home.
Original Mortgage
$86,400
Interest Rate
7.7%
Mortgage Type
New Conventional
Create a Home Valuation Report for This Property
The Home Valuation Report is an in-depth analysis detailing your home's value as well as a comparison with similar homes in the area
Home Values in the Area
Average Home Value in this Area
Purchase History
| Date | Buyer | Sale Price | Title Company |
|---|---|---|---|
| Cavileer John F | $300,000 | Hartung Title Agency Inc | |
| Haag Robert D | $150,000 | -- | |
| Baker Frank B | $108,000 | -- |
Source: Public Records
Mortgage History
| Date | Status | Borrower | Loan Amount |
|---|---|---|---|
| Previous Owner | Haag Robert D | $120,000 | |
| Previous Owner | Baker Frank B | $86,400 |
Source: Public Records
Tax History
| Year | Tax Paid | Tax Assessment Tax Assessment Total Assessment is a certain percentage of the fair market value that is determined by local assessors to be the total taxable value of land and additions on the property. | Land | Improvement |
|---|---|---|---|---|
| 2024 | $6,033 | $176,289 | $67,729 | $108,560 |
| 2023 | $6,009 | $114,790 | $40,163 | $74,627 |
| 2022 | $3,963 | $114,790 | $40,163 | $74,627 |
| 2021 | $3,975 | $114,790 | $40,160 | $74,630 |
| 2020 | $3,553 | $97,100 | $39,380 | $57,720 |
| 2019 | $3,287 | $97,100 | $39,380 | $57,720 |
| 2018 | $3,283 | $97,100 | $39,380 | $57,720 |
| 2017 | $3,046 | $89,170 | $36,790 | $52,380 |
| 2016 | $3,015 | $89,170 | $36,790 | $52,380 |
| 2015 | $3,026 | $89,170 | $36,790 | $52,380 |
| 2014 | $1,519 | $87,450 | $36,790 | $50,660 |
| 2013 | $2,819 | $87,450 | $36,790 | $50,660 |
Source: Public Records
Map
Nearby Homes
- 212 E 7th St
- 446 Lynn Ave
- 723 Oak Ave
- 727 Oak Ave
- 132 E 4th St
- 721 Laurel Ave
- 317 Maple Ave Unit 17
- 317 Oak Ave
- 224 Oak Ave
- 1209 Prairie St
- 269 Lighthouse Oval
- 282 N Lighthouse Oval
- 280 N Lighthouse Oval
- 281 N Lighthouse Oval
- 275 N Lighthouse Oval
- 5486 E Harbor Rd
- 385 Hidden Beach Rd
- 347 Hidden Beach Rd
- 0 S Harbor Bay Dr Unit 20210331
- 271 Willowdale Dr
Your Personal Tour Guide
Ask me questions while you tour the home.